Porsche 2012 Annual Report Download - page 196
Download and view the complete annual report
Please find page 196 of the 2012 Porsche annual report below. You can navigate through the pages in the report by either clicking on the pages listed below, or by using the keyword search tool below to find specific information within the annual report.-
 1
1 -
2
-
3
-
4
-
5
-
6
-
7
-
8
-
9
-
10
-
11
-
12
-
13
-
14
-
15
-
16
-
17
-
18
-
19
-
20
-
21
-
22
-
23
-
24
-
25
-
26
-
27
-
28
-
29
-
30
-
31
-
32
-
33
-
34
-
35
-
36
-
37
-
38
-
39
-
40
-
41
-
42
-
43
-
44
-
45
-
46
-
47
-
48
-
49
-
50
-
51
-
52
-
53
-
54
-
55
-
56
-
57
-
58
-
59
-
60
-
61
-
62
-
63
-
64
-
65
-
66
-
67
-
68
-
69
-
70
-
71
-
72
-
73
-
74
-
75
-
76
-
77
-
78
-
79
-
80
-
81
-
82
-
83
-
84
-
85
-
86
-
87
-
88
-
89
-
90
-
91
-
92
-
93
-
94
-
95
-
96
-
97
-
98
-
99
-
100
-
101
-
102
-
103
-
104
-
105
-
106
-
107
-
108
-
109
-
110
-
111
-
112
-
113
-
114
-
115
-
116
-
117
-
118
-
119
-
120
-
121
-
122
-
123
-
124
-
125
-
126
-
127
-
128
-
129
-
130
-
131
-
132
-
133
-
134
-
135
-
136
-
137
-
138
-
139
-
140
-
141
-
142
-
143
-
144
-
145
-
146
-
147
-
148
-
149
-
150
-
151
-
152
-
153
-
154
-
155
-
156
-
157
-
158
-
159
-
160
-
161
-
162
-
163
-
164
-
165
-
166
-
167
-
168
-
169
-
170
-
171
-
172
-
173
-
174
-
175
-
176
-
177
-
178
-
179
-
180
-
181
-
182
-
183
-
184
-
185
-
 186
186 -
 187
187 -
 188
188 -
 189
189 -
 190
190 -
 191
191 -
 192
192 -
 193
193 -
 194
194 -
 195
195 -
 196
196 -
 197
197 -
 198
198 -
 199
199 -
 200
200 -
 201
201 -
 202
202 -
 203
203 -
 204
204 -
 205
205 -
 206
206 -
207
-
208
-
209
-
210
-
211
-
212
-
213
-
214
-
215
-
216
-
217
-
218
-
219
-
220
-
221
-
222
-
223
-
224
-
225
-
226
-
227
-
228
-
229
-
230
-
231
-
232
-
233
-
234
-
235
-
236
-
237
-
238
-
239
-
240
-
241
-
242
-
243
-
244
-
245
-
246
-
247
-
248
-
249
-
250
-
251
-
252
-
253
-
254
-
255
-
256
-
257
-
258
-
259
-
260
-
261
-
262
-
263
-
264
-
265
-
266
-
267
-
268
-
269
-
270
 |
 |
Financials
Notes to the consolidated fi nancial statements
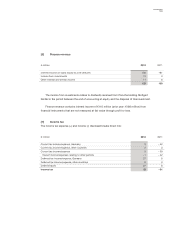
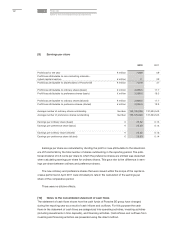
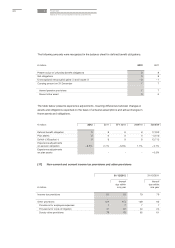
[9] Earnings per share
Earnings per share are calculated by dividing the profit or loss attributable to the sharehold-
ers of Porsche SE by the total number of shares outstanding in the reporting period. The addi-
tional dividend of 0.6 cents per share to which the preference shares are entitled was deducted
when calculating earnings per share for ordinary shares. This gave rise to the difference in earn-
ings per share between ordinary and preference shares.
The new ordinary and preference shares that were issued within the scope of the capital in-
crease performed in April 2011 were included pro rata in the calculation of the earnings per
share of the comparative period.
There were no dilutive effects.
[10] Notes to the consolidated statement of cash flows
The statement of cash flows shows how the cash funds of Porsche SE group have changed
during the reporting year as a result of cash inflows and outflows. For this purpose the cash
flows in the statement of cash flows are categorized into operating activities, investing activities
(including investments in time deposits), and financing activities. Cash inflows and outflows from
investing and financing activities are presented using the direct method.
2012 2011
Profit/loss for the year € million 7,829 59
Profit/loss attributable to non-controlling interests –
hybrid capital investors € million 11 22
Profit/loss attributable to shareholders of Porsche SE € million 7,818 37
Profit/loss attributable to ordinary shares (basic) € million 3,908.5 17.7
Profit/loss attributable to preference shares (basic) € million 3,909.5 19.3
Profit/loss attributable to ordinary shares (diluted) € million 3,908.5 17.7
Profit/loss attributable to preference shares (diluted) € million 3,909.5 19.3
Average number of ordinary shares outstanding Number 153,125,000 137,524,543
Average number of preference shares outstanding Number 153,125,000 137,524,543
Earnings per ordinary share (basic) € 25.52 0.13
Earnings per preference share (basic) € 25.53 0.14
Earnings per ordinary share (diluted) € 25.52 0.13
Earnings per preference share (diluted) € 25.53 0.14
3192