Porsche 2012 Annual Report Download - page 213
Download and view the complete annual report
Please find page 213 of the 2012 Porsche annual report below. You can navigate through the pages in the report by either clicking on the pages listed below, or by using the keyword search tool below to find specific information within the annual report.-
 1
1 -
2
-
3
-
4
-
5
-
6
-
7
-
8
-
9
-
10
-
11
-
12
-
13
-
14
-
15
-
16
-
17
-
18
-
19
-
20
-
21
-
22
-
23
-
24
-
25
-
26
-
27
-
28
-
29
-
30
-
31
-
32
-
33
-
34
-
35
-
36
-
37
-
38
-
39
-
40
-
41
-
42
-
43
-
44
-
45
-
46
-
47
-
48
-
49
-
50
-
51
-
52
-
53
-
54
-
55
-
56
-
57
-
58
-
59
-
60
-
61
-
62
-
63
-
64
-
65
-
66
-
67
-
68
-
69
-
70
-
71
-
72
-
73
-
74
-
75
-
76
-
77
-
78
-
79
-
80
-
81
-
82
-
83
-
84
-
85
-
86
-
87
-
88
-
89
-
90
-
91
-
92
-
93
-
94
-
95
-
96
-
97
-
98
-
99
-
100
-
101
-
102
-
103
-
104
-
105
-
106
-
107
-
108
-
109
-
110
-
111
-
112
-
113
-
114
-
115
-
116
-
117
-
118
-
119
-
120
-
121
-
122
-
123
-
124
-
125
-
126
-
127
-
128
-
129
-
130
-
131
-
132
-
133
-
134
-
135
-
136
-
137
-
138
-
139
-
140
-
141
-
142
-
143
-
144
-
145
-
146
-
147
-
148
-
149
-
150
-
151
-
152
-
153
-
154
-
155
-
156
-
157
-
158
-
159
-
160
-
161
-
162
-
163
-
164
-
165
-
166
-
167
-
168
-
169
-
170
-
171
-
172
-
173
-
174
-
175
-
176
-
177
-
178
-
179
-
180
-
181
-
182
-
183
-
184
-
185
-
186
-
187
-
188
-
189
-
190
-
191
-
192
-
193
-
194
-
195
-
196
-
197
-
198
-
199
-
200
-
201
-
202
-
 203
203 -
 204
204 -
 205
205 -
 206
206 -
 207
207 -
 208
208 -
 209
209 -
 210
210 -
 211
211 -
 212
212 -
 213
213 -
 214
214 -
 215
215 -
 216
216 -
 217
217 -
 218
218 -
 219
219 -
 220
220 -
 221
221 -
 222
222 -
 223
223 -
224
-
225
-
226
-
227
-
228
-
229
-
230
-
231
-
232
-
233
-
234
-
235
-
236
-
237
-
238
-
239
-
240
-
241
-
242
-
243
-
244
-
245
-
246
-
247
-
248
-
249
-
250
-
251
-
252
-
253
-
254
-
255
-
256
-
257
-
258
-
259
-
260
-
261
-
262
-
263
-
264
-
265
-
266
-
267
-
268
-
269
-
270
 |
 |
The receivables rated as good are allocated to risk class 1. Receivables from customers
whose credit rating are not good, but have not yet defaulted, are allocated to risk class 2. Allo-
cation to the risk classes is based on the borrower’s external rating or liquidity planning, which
documents their solvency. In the latter case, compliance with any existing covenants from other
loan agreements is checked as of the reporting date.
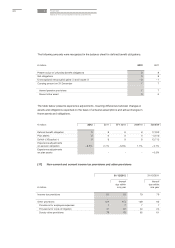
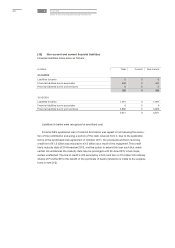
3 Liquidity risk
The solvency and liquidity of the Porsche SE group is continuously monitored by means of
liquidity planning. Solvency and liquidity are additionally secured by a cash liquidity reserve and
guaranteed credit lines. Porsche SE's total credit facility as of the reporting date amounts to
€1,000 million (prior year: €3,500 million). This was not utilized as of the reporting date (prior
year: €2,000 million), such that an undrawn line of credit of €1,000 million remains (prior year:
€1,500 million). Reference is made to explanations on the management of liquidity risks in the
Porsche SE group and risks originating from financial covenants presented in the risk report as
part of the group management report.
Liquid funds comprise the cash, cash equivalents and time deposits reported in the balance
sheet.
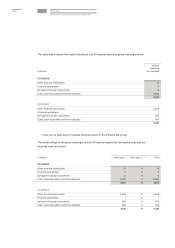
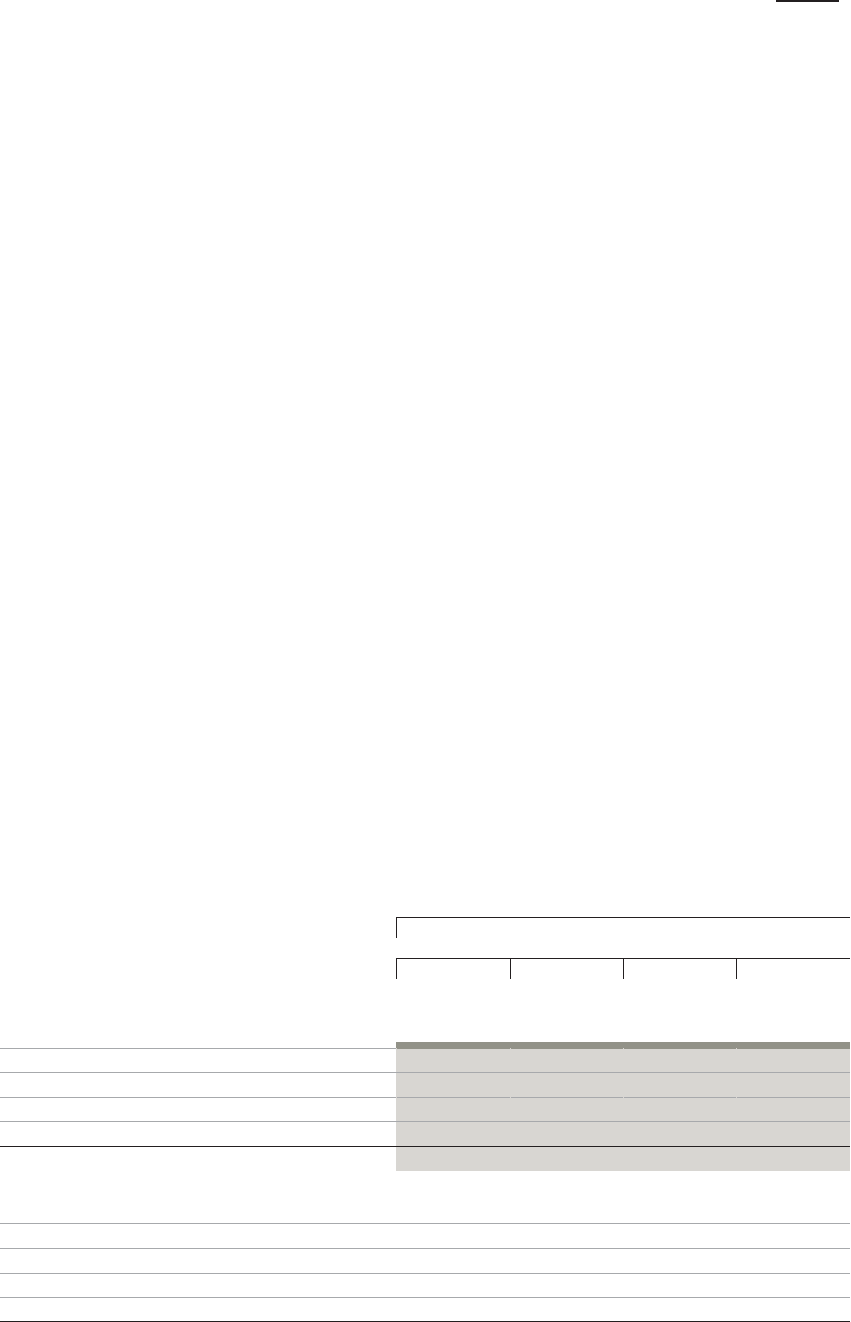
The following overview shows the contractual undiscounted cash outflows from financial liabili-
ties and financial guarantees:
Remaining contractual maturities
within one in 1 to 5 in more than Total
€ million year years five years
31/12/2012
Financial liabilities 21 376 0 397
Trade payables 7 0 0 7
Other financial liabilities 501 0 0 501
Financial guarantees 1,674 0 0 1,674
2,203 376 0 2,579
31/12/2011
Financial liabilities 382 6,247 0 6,629
Trade payables 9 0 0 9
Other financial liabilities 150 0 0 150
Financial guarantees 2,152 0 0 2,152
2,693 6,247 0 8,940
209