Porsche 2004 Annual Report Download - page 152
Download and view the complete annual report
Please find page 152 of the 2004 Porsche annual report below. You can navigate through the pages in the report by either clicking on the pages listed below, or by using the keyword search tool below to find specific information within the annual report.-
 1
1 -
2
-
3
-
4
-
5
-
6
-
7
-
8
-
9
-
10
-
11
-
12
-
13
-
14
-
15
-
16
-
17
-
18
-
19
-
20
-
21
-
22
-
23
-
24
-
25
-
26
-
27
-
28
-
29
-
30
-
31
-
32
-
33
-
34
-
35
-
36
-
37
-
38
-
39
-
40
-
41
-
42
-
43
-
44
-
45
-
46
-
47
-
48
-
49
-
50
-
51
-
52
-
53
-
54
-
55
-
56
-
57
-
58
-
59
-
60
-
61
-
62
-
63
-
64
-
65
-
66
-
67
-
68
-
69
-
70
-
71
-
72
-
73
-
74
-
75
-
76
-
77
-
78
-
79
-
80
-
81
-
82
-
83
-
84
-
85
-
86
-
87
-
88
-
89
-
90
-
91
-
92
-
93
-
94
-
95
-
96
-
97
-
98
-
99
-
100
-
101
-
102
-
103
-
104
-
105
-
106
-
107
-
108
-
109
-
110
-
111
-
112
-
113
-
114
-
115
-
116
-
117
-
118
-
119
-
120
-
121
-
122
-
123
-
124
-
125
-
126
-
127
-
128
-
129
-
130
-
131
-
132
-
133
-
134
-
135
-
136
-
137
-
138
-
139
-
140
-
141
-
 142
142 -
 143
143 -
 144
144 -
 145
145 -
 146
146 -
 147
147 -
 148
148 -
 149
149 -
 150
150 -
 151
151 -
 152
152 -
 153
153 -
 154
154 -
 155
155 -
 156
156 -
 157
157 -
 158
158 -
 159
159 -
 160
160 -
 161
161 -
 162
162 -
163
-
164
-
165
-
166
-
167
-
168
 |
 |
Notes to the Consolidated Financial Statements
Other
Notes
148
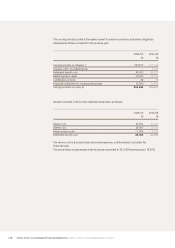
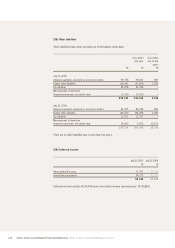
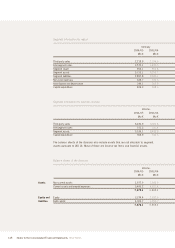
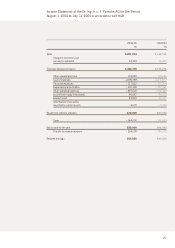
Germany
2004/05 2003/04
Mio € Mio €
Third-party sales 2,218.9 2,076.6
Intersegment sales 3,570.1 3,483.5
Segment result 902.1 853.8
Segment assets 5,313.1 5,206.7
Segment liabilities 2,897.8 2,622.1
Non-cash expenses 328.7 505.3
Amortization and depreciation 346.1 262.5
Capital expenditure 409.3 668.3
Vehicles
2004/05 2003/04
Mio € Mio €
Third-party sales 6,220.9 5,821.8
Intersegment sales 151.2 141.4
Segment assets 5,536.1 5,445.5
Capital expenditure 368.9 632.3
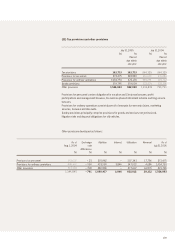
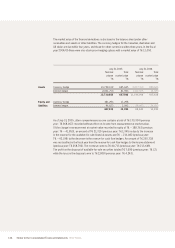
Segment information by region
Segment information by business division
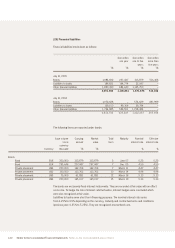
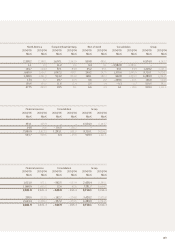
Vehicles
2004/05 2003/04
Mio € Mio €
Non-current assets 1,977.9 1,966.9
Current assets and prepaid expenses 5,400.2 4,921.4
7,378.1 6,888.3
Equity 3,374.4 2,932.6
Debt capital 4,003.7 3,955.7
7,378.1 6,888.3
Assets
Equity and
liabilities
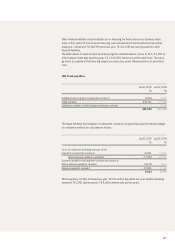
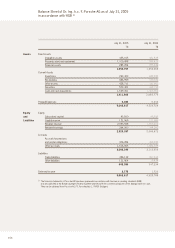
Balance sheets of the divisions
The balance sheets of the divisions also include assets that are not allocable to segment
assets pursuant to IAS 14. Most of these are income tax items and financial assets.