Porsche 2004 Annual Report Download - page 132
Download and view the complete annual report
Please find page 132 of the 2004 Porsche annual report below. You can navigate through the pages in the report by either clicking on the pages listed below, or by using the keyword search tool below to find specific information within the annual report.-
 1
1 -
2
-
3
-
4
-
5
-
6
-
7
-
8
-
9
-
10
-
11
-
12
-
13
-
14
-
15
-
16
-
17
-
18
-
19
-
20
-
21
-
22
-
23
-
24
-
25
-
26
-
27
-
28
-
29
-
30
-
31
-
32
-
33
-
34
-
35
-
36
-
37
-
38
-
39
-
40
-
41
-
42
-
43
-
44
-
45
-
46
-
47
-
48
-
49
-
50
-
51
-
52
-
53
-
54
-
55
-
56
-
57
-
58
-
59
-
60
-
61
-
62
-
63
-
64
-
65
-
66
-
67
-
68
-
69
-
70
-
71
-
72
-
73
-
74
-
75
-
76
-
77
-
78
-
79
-
80
-
81
-
82
-
83
-
84
-
85
-
86
-
87
-
88
-
89
-
90
-
91
-
92
-
93
-
94
-
95
-
96
-
97
-
98
-
99
-
100
-
101
-
102
-
103
-
104
-
105
-
106
-
107
-
108
-
109
-
110
-
111
-
112
-
113
-
114
-
115
-
116
-
117
-
118
-
119
-
120
-
121
-
 122
122 -
 123
123 -
 124
124 -
 125
125 -
 126
126 -
 127
127 -
 128
128 -
 129
129 -
 130
130 -
 131
131 -
 132
132 -
 133
133 -
 134
134 -
 135
135 -
 136
136 -
 137
137 -
 138
138 -
 139
139 -
 140
140 -
 141
141 -
 142
142 -
143
-
144
-
145
-
146
-
147
-
148
-
149
-
150
-
151
-
152
-
153
-
154
-
155
-
156
-
157
-
158
-
159
-
160
-
161
-
162
-
163
-
164
-
165
-
166
-
167
-
168
 |
 |

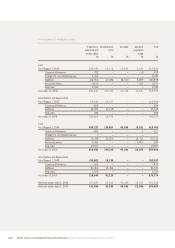
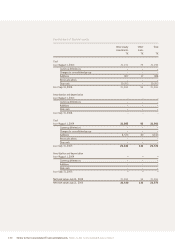
Notes to the Consolidated Financial Statements Notes to the Consolidated Balance Sheet
128
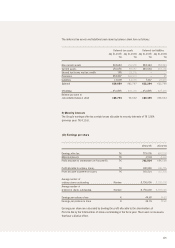
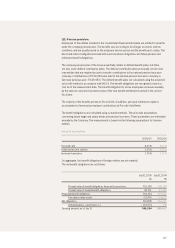
Franchises, Development Goodwill Advance Total
industrial and costs payments
similar rights made
T€ T€ T€ T€ T€
Cost
As of August 1, 2003 240,645 63,173 10,820 5,184 319,822
Currency differences – 782 – – – 10 – 792
Changes to consolidated group 2,347 – – – 2,347
Additions 112,956 47,484 34,530 8,889 203,859
Reclassifications 4,103 – – – 532 3,571
Disposals 9,042 – – – 9,042
As of July 31, 2004 350,227 110,657 45,350 13,531 519,765
Amortization and depreciation
As of August 1, 2003 95,433 22,627 – – 118,060
Currency differences – 609 – – – – 609
Additions 64,224 11,108 – – 75,332
Disposals 246 – – – 246
As of July 31, 2004 158,802 33,735 – – 192,537
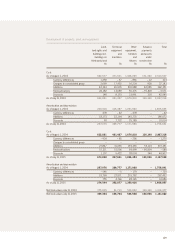
Cost
As of August 1, 2004 350,227 110,657 45,350 13,531 519,765
Currency differences – 506 – – – 5 – 511
Changes to consolidated group – – – – –
Additions 15,348 33,655 – 14,332 63,335
Reclassifications 6,391 – – – 5,803 588
Disposals 18,817 – – – 18,817
As of July 31, 2005 352,643 144,312 45,350 22,055 564,360
Amortization and depreciation
As of August 1, 2004 158,802 33,735 – – 192,537
Currency differences – 435 – – – – 435
Additions 62,803 18,394 – – 81,197
Disposals 2,526 – – – 2,526
As of July 31, 2005 218,644 52,129 – – 270,773
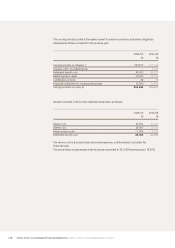
Net book values July 31, 2004 191,425 76,922 45,350 13,531 327,228
Net book values July 31, 2005 133,999 92,183 45,350 22,055 293,587
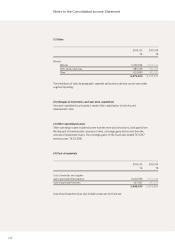
Development of intangible assets