Pepsi 2010 Annual Report Download - page 16
Download and view the complete annual report
Please find page 16 of the 2010 Pepsi annual report below. You can navigate through the pages in the report by either clicking on the pages listed below, or by using the keyword search tool below to find specific information within the annual report.
15
Food
51%
49%
Beverage
U.S.
Outside
the U.S.
53%
47%
PepsiCo
AMEA
PepsiCo
Europe
PepsiCo
Americas
Beverages
37%
16% PepsiCo
Americas
Foods
12%
35%
PepsiCo
AMEA
PepsiCo
Europe
PepsiCo
Americas
Beverages
53%
10%
PepsiCo
Americas
Foods
8%
29%
U.S. Dollars
150
100
50
2005 2006 2007 2008 2009 2010
PepsiCo, Inc. S&P 500® S&P® Average of Industry Groups***
Financial Highlights
PepsiCo, Inc. and subsidiaries
(in millions except per share data; all per share amounts assume dilution)
Chg
Constant
2010 2009 Chg(a) Currency(a)(f)
Summary of Operations
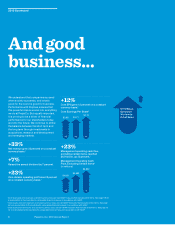
Total net revenue $57,838 $43,232 34% 33%
Core division operating prot(b) $10,626 $ 8,647 23% 23%
Core total operating prot(c) $ 9,773 $ 7,856 24%
Core net income attributable to PepsiCo(d) $ 6,675 $ 5,846 14%
Core earnings per share attributable to PepsiCo(d) $ 4.13 $ 3.71 12% 12%
Other Data
Management operating cash ow,
excluding certain items(e) $ 6,892 $ 5,583 23%
Net cash provided by operating activities $ 8,448 $ 6,796 24%
Capital spending $ 3,253 $ 2,128 53%
Common share repurchases $ 4,978 – n/m
Dividends paid $ 2,978 $ 2,732 9%
Long-term debt $19,999 $ 7,400 170%
(a) Percentage changes are based on unrounded amounts.
(b) Excludes corporate unallocated expenses and merger and integration charges in both years. In 2010, also excludes certain inventory fair value adjustments in connection with
our bottling acquisitions and a one-time net charge related to the currency devaluation in Venezuela. In 2009, also excludes restructuring and impairment charges. See page
108 for a reconciliation to the most directly comparable nancial measure in accordance with GAAP.
(c) Excludes merger and integration charges and the net mark-to-market impact of our commodity hedges in both years. In 2010, also excludes certain inventory fair value
adjustments in connection with our bottling acquisitions, a one-time net charge related to the currency devaluation in Venezuela, an asset write-off charge for SAP software
and a contribution to The PepsiCo Foundation, Inc. In 2009, also excludes restructuring and impairment charges. See page 108 for a reconciliation to the most directly
comparable nancial measure in accordance with GAAP.
(d) Excludes merger and integration charges and the net mark-to-market impact of our commodity hedges in both years. In 2010, also excludes a gain on previously held equity
interests and certain inventory fair value adjustments in connection with our bottling acquisitions, a one-time net charge related to the currency devaluation in Venezuela, an
asset write-off charge for SAP software, a contribution to The PepsiCo Foundation, Inc. and interest expense incurred in connection with our debt repurchase. In 2009, also
excludes restructuring and impairment charges. See pages 64 and 108 for reconciliations to the most directly comparable nancial measures in accordance with GAAP.
(e) Includes the impact of net capital spending, and excludes merger and integration payments and restructuring payments in both years. In 2010, also excludes discretionary
pension and retiree medical payments, a contribution to The PepsiCo Foundation, Inc., interest paid related to our debt repurchase and capital expenditures related to the
integration of our bottlers. In 2009, also excludes discretionary pension payments. See also “Our Liquidity and Capital Resources” in Management’s Discussion and Analysis.
See page 108 for a reconciliation to the most directly comparable nancial measure in accordance with GAAP.
(f) Assumes constant currency exchange rates used for translation based on the rates in effect in 2009. See pages 64 and 108 for reconciliations to the most directly comparable
nancial measures in accordance with GAAP.
Mix of Net Revenue
Net Revenues
Division Operating Prot
Cumulative Total Shareholder Return
Return on PepsiCo stock investment (including dividends), the S&P 500 and the S&P Average of Industry Groups
Dec. 05 Dec. 06 Dec. 07 Dec. 08 Dec. 09 Dec. 10
PepsiCo Inc. $100 $108 $134 $ 99 $113 $125
S&P 500® $100 $116 $122 $ 77 $ 97 $112
S&P® Avg. of Industry Groups*** $100 $116 $129 $106 $128 $151
*** The S&P Average of Industry Groups is derived by weighting the returns of two applicable S&P Industry Groups
(Non-Alcoholic Beverages and Food) by PepsiCo’s sales in its beverages and foods businesses. The returns for
PepsiCo, the S&P 500 and the S&P Average indices are calculated through December 31, 2010.


