Pepsi 2010 Annual Report Download - page 10
Download and view the complete annual report
Please find page 10 of the 2010 Pepsi annual report below. You can navigate through the pages in the report by either clicking on the pages listed below, or by using the keyword search tool below to find specific information within the annual report.-
 1
1 -
 2
2 -
 3
3 -
 4
4 -
 5
5 -
 6
6 -
 7
7 -
 8
8 -
 9
9 -
 10
10 -
 11
11 -
 12
12 -
 13
13 -
 14
14 -
 15
15 -
 16
16 -
 17
17 -
 18
18 -
 19
19 -
 20
20 -
 21
21 -
22
-
23
-
24
-
25
-
26
-
27
-
28
-
29
-
30
-
31
-
32
-
33
-
34
-
35
-
36
-
37
-
38
-
39
-
40
-
41
-
42
-
43
-
44
-
45
-
46
-
47
-
48
-
49
-
50
-
51
-
52
-
53
-
54
-
55
-
56
-
57
-
58
-
59
-
60
-
61
-
62
-
63
-
64
-
65
-
66
-
67
-
68
-
69
-
70
-
71
-
72
-
73
-
74
-
75
-
76
-
77
-
78
-
79
-
80
-
81
-
82
-
83
-
84
-
85
-
86
-
87
-
88
-
89
-
90
-
91
-
92
-
93
-
94
-
95
-
96
-
97
-
98
-
99
-
100
-
101
-
102
-
103
-
104
-
105
-
106
-
107
-
108
-
109
-
110
-
111
-
112
-
113
 |
 |

2010 Scorecard
08 09 10
$3.68 $3.71 $4.13
08 09 10
$4,831
$5,583
$6,892
8PepsiCo, Inc. 2010 Annual Report
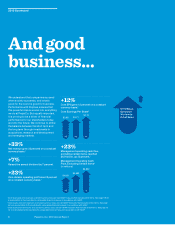
And good
business...
+12%
Core EPS grew 12 percent on a constant
currency basis.2
Core Earnings Per Share2
We understand that companies succeed
when society succeeds, and what’s
good for the world is good for business.
Performance with Purpose ensures that
this powerful idea is woven into everything
we do at PepsiCo. But equally important,
it is proving to be a driver of nancial
performance for our shareholders today
and into the future. We continue to strike
the balance between the short term and
the long term through investments in
acquisitions, research and development
and emerging markets.
+33%
Net revenue grew 33 percent on a constant
currency basis.1
+7%
Raised the annual dividend by 7 percent.
+23%
Core division operating prot rose 23 percent
on a constant currency basis.1
+23%
Management operating cash ow,
excluding certain items, reached
$6.9billion, up 23 percent.1
Management Operating Cash
Flow, Excluding Certain Items3
(in millions)
$119 Billion
Estimated
Worldwide
Retail Sales
1 Core results and core results on a constant currency basis are non-GAAP measures that exclude certain items. See page 108 for
a reconciliation to the most directly comparable nancial measure in accordance with GAAP.
2 Core results and core results on a constant currency basis are non-GAAP measures that exclude certain items. See page
64 for a reconciliation to the most directly comparable nancial measure in accordance with GAAP.
3 Core results and core results on a constant currency basis are non-GAAP measures that exclude certain items. See page 70
for a reconciliation to the most directly comparable nancial measure in accordance with GAAP.