Pepsi 2010 Annual Report Download - page 11
Download and view the complete annual report
Please find page 11 of the 2010 Pepsi annual report below. You can navigate through the pages in the report by either clicking on the pages listed below, or by using the keyword search tool below to find specific information within the annual report.-
 1
1 -
 2
2 -
 3
3 -
 4
4 -
 5
5 -
 6
6 -
 7
7 -
 8
8 -
 9
9 -
 10
10 -
 11
11 -
 12
12 -
 13
13 -
 14
14 -
 15
15 -
 16
16 -
 17
17 -
 18
18 -
 19
19 -
 20
20 -
 21
21 -
 22
22 -
23
-
24
-
25
-
26
-
27
-
28
-
29
-
30
-
31
-
32
-
33
-
34
-
35
-
36
-
37
-
38
-
39
-
40
-
41
-
42
-
43
-
44
-
45
-
46
-
47
-
48
-
49
-
50
-
51
-
52
-
53
-
54
-
55
-
56
-
57
-
58
-
59
-
60
-
61
-
62
-
63
-
64
-
65
-
66
-
67
-
68
-
69
-
70
-
71
-
72
-
73
-
74
-
75
-
76
-
77
-
78
-
79
-
80
-
81
-
82
-
83
-
84
-
85
-
86
-
87
-
88
-
89
-
90
-
91
-
92
-
93
-
94
-
95
-
96
-
97
-
98
-
99
-
100
-
101
-
102
-
103
-
104
-
105
-
106
-
107
-
108
-
109
-
110
-
111
-
112
-
113
 |
 |

9
Watch an introductory video with PepsiCo’s Chairman at
www.PepsiCo.com/annual10.
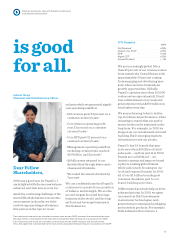
Indra K. Nooyi
Chairman and Chief Executive Ofcer
is good
for all.
Dear Fellow
Shareholders,
2010 was a good year for PepsiCo. I
am delighted with the success we have
achieved, and I am sure you aretoo.
Amid the continuing challenge of the
most dicult global macroeconomic
environment in decades, we deliv-
ered strong operating performance
that puts us in the top tier in our
industry while we generated signifi-
cant operating cash flow.
• Net revenue grew 33percent on a
constant currency basis.1
• Core division operating profit
rose 23percent on a constant
currency basis.1
• Core EPS grew 12 percent on a
constant currency basis.2
• Management operating cash flow,
excluding certain items, reached
$6.9billion, up 23percent.1
• $8 billion was returned to our
shareholders through share repur-
chases and dividends.
• We raised the annual dividend by
7percent.
We can confidently say that PepsiCo
continues to operate from a position
of balance and strength. We are the
second-largest food and beverage
business in the world, and the larg-
est food and beverage business in
NorthAmerica.
We are increasingly global. More
than 45percent of our revenue comes
from outside the United States, with
approximately 30percent coming
from emerging and developing mar-
kets, where we have tremendous
growth opportunities. Globally,
PepsiCo operates more than 100,000
routes, serves approximately 10mil-
lion outlets almost every week and
generates more than $300million in
retail sales everyday.
We are performing today to deliver
top-tier financial performance, while
investing to ensure that our perfor-
mance levels can be sustained in the
long term. For example, in 2010 we
stepped up our investments in brand
building, R&D, emerging markets
infrastructure and ourpeople.
PepsiCo has 19 brands that gen-
erate more than $1billion of retail
sales each — up from just 11 in 2000.
Brands are our lifeblood — we
invest to sustain and improve brand
equity in existing global brands
while judiciously focusing on our
local and regional brands. In 2010,
all of our $1billion brands grew
revenues, thanks in part to our
brand-buildingactivities.
Dierentiated products help us drive
sales and pricing. In 2010, we again
increased our R&D investments
in sweetener technologies, next-
generation processing and packaging
and nutrition products. For example,
SoBe Lifewater Zero Calorie, a
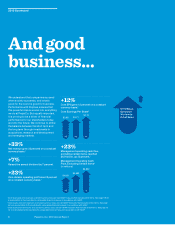
2010 Snapshot
%PY
Net Revenue1 +33%
Division Op. Prot1 +23%
EPS2 +12%
Mgmt OCF1 +23%
Annual Dividend + 7%
1 Core results and core results on a constant currency basis are non-GAAP measures that exclude certain items.
See page 108 for a reconciliation to the most directly comparable nancial measure in accordance with GAAP.
2 Core results and core results on a constant currency basis are non-GAAP measures that exclude certain
items. See page 64 for a reconciliation to the most directly comparable nancial measure in accordance with GAAP.