Pepsi 2010 Annual Report Download
Download and view the complete annual report
Please find the complete 2010 Pepsi annual report below. You can navigate through the pages in the report by either clicking on the pages listed below, or by using the keyword search tool below to find specific information within the annual report.-
 1
1 -
 2
2 -
 3
3 -
 4
4 -
 5
5 -
 6
6 -
 7
7 -
 8
8 -
 9
9 -
 10
10 -
 11
11 -
 12
12 -
13
-
14
-
15
-
16
-
17
-
18
-
19
-
20
-
21
-
22
-
23
-
24
-
25
-
26
-
27
-
28
-
29
-
30
-
31
-
32
-
33
-
34
-
35
-
36
-
37
-
38
-
39
-
40
-
41
-
42
-
43
-
44
-
45
-
46
-
47
-
48
-
49
-
50
-
51
-
52
-
53
-
54
-
55
-
56
-
57
-
58
-
59
-
60
-
61
-
62
-
63
-
64
-
65
-
66
-
67
-
68
-
69
-
70
-
71
-
72
-
73
-
74
-
75
-
76
-
77
-
78
-
79
-
80
-
81
-
82
-
83
-
84
-
85
-
86
-
87
-
88
-
89
-
90
-
91
-
92
-
93
-
94
-
95
-
96
-
97
-
98
-
99
-
100
-
101
-
102
-
103
-
104
-
105
-
106
-
107
-
108
-
109
-
110
-
111
-
112
-
113
 |
 |

Performance
with Purpose
The Promise of PepsiCo
2010 Annual Report
Table of contents
-
Page 1
Performance with Purpose The Promise of PepsiCo 2010 Annual Report -
Page 2
Good for all... -
Page 3
... sustainable growth by investing in a healthier future for people and our planet. As a global food and beverage company with brands that stand for quality and are respected household names - Pepsi-Cola, Lay's, Quaker Oats, Tropicana and Gatorade, to name but a few - we will continue to build... -
Page 4
... in our portfolio for consumers to have a range of enjoyable and wholesome foods and beverages. We believe it's about providing people with choices, options to manage their portions, better nutrition education and compelling programs to encourage physical activity. But choice is the key. By 2020, we... -
Page 5
...world's secondlargest food and beverage business with an unparalleled distribution system, we are uniquely situated to lead the way in these changing market dynamics. We believe the expansion of our Goodfor-You portfolio will help PepsiCo attain a competitive advantage in a global packaged-nutrition... -
Page 6
... sustainable growing practices, improve crop yields and support local growing collaboratives. These initiatives are simply the right thing to do, and they also demonstrate PepsiCo's interest in the development of the agricultural supply chain in emerging markets. 4 PepsiCo, Inc. 2010 Annual Report -
Page 7
... "good company" is good for society and the communities where we operate, and it is an imperative for increasing our profitability. Environmental initiatives help us identify business synergies and cut our operating costs. Equally important is improving efficiencies in packaging materials, water and... -
Page 8
... will help to sustain PepsiCo's long-term growth. A key component is attracting and developing the best people and empowering them to be innovative, take on new responsibilities and pursue exciting opportunities for themselves and the company. We're also committed to supporting our associates, their... -
Page 9
is good for business. To maintain a leadership position in a changing world, we must rethink how we work, implement efficient new ways to collaborate on a global scale and share operational best practices throughout our organization. Our commitment to diversity in the workforce means we understand, ... -
Page 10
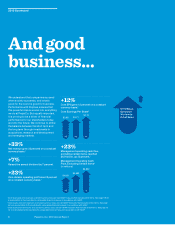
...at PepsiCo. But equally important, it is proving to be a driver of financial performance for our shareholders today and into the future. We continue to strike the balance between the short term and the long term through investments in acquisitions, research and development and emerging markets. +12... -
Page 11
...all of our $1 billion brands grew revenues, thanks in part to our brand-building activities. Differentiated products help us drive sales and pricing. In 2010, we again increased our R&D investments in sweetener technologies, nextgeneration processing and packaging and nutrition products. For example... -
Page 12
...at the cost of creating value for shareholders. It is the source of that value. It's all about bringing our company performance and our social and environmental commitments together. We set a series of long-term targets, but ensured that they also supported our short-term needs. Our business and our... -
Page 13
... and Beverages Fun-for-You Portfolio These products are part of PepsiCo's core food and beverage businesses. Pepsi: The bold, refreshing, robust cola Red Rock Deli Potato Chips: Seasoned with delicious deli-inspired flavors Better-for-You Portfolio These are foods and beverages that have levels... -
Page 14
..., achieving positive water balance in India in 2009 and creating a new Agricultural Development Center in Peru in 2010. Talent Sustainability Talent sustainability is our promise to invest in our associates. Our goal is to help them succeed and develop the skills needed to drive the company's growth... -
Page 15
... behind Pepsi Max. In 2011, we have a laser-like focus on taking our profitable North America beverage business and growing it sustainably for the future. We are continuing, at the same time, to invest in emerging and developing markets - including, of course, the vital China and India markets. Our... -
Page 16
... Foods Cumulative Total Shareholder Return Return on PepsiCo stock investment (including dividends), the S&P 500 and the S&P Average of Industry Groups PepsiCo, Inc. S&P 500® S&P® Average of Industry Groups*** 150 U.S. Dollars PepsiCo Americas Beverages 35% 100 Division Operating Profit... -
Page 17
... generated $1 billion or more in 2010 in annual retail sales (estimated worldwide retail sales in billions). $10 $15 $20 $25 Pepsi-Cola Mountain Dew / Mtn Dew Lay's Potato Chips Gatorade (Thirst Quencher, G2, Propel) Tropicana Beverages Diet Pepsi 7UP (outside U.S.) Lipton Teas (PepsiCo/Unilever... -
Page 18
... J. Schiro Former Chief Executive Officer, Zurich Financial Services 65. Elected 2003. Presiding Director Ray L. Hunt Chairman of the Board, President and Chief Executive Officer, Hunt Consolidated, Inc. 67. Elected 1996. Lloyd G. Trotter Managing Partner, GenNx360 Capital Partners 65. Elected... -
Page 19
..., PepsiCo Europe Saad Abdul-Latif Chief Executive Officer, PepsiCo Asia, Middle East & Africa Peter A. Bridgman Senior Vice President, Controller, PepsiCo Albert P. Carey President and Chief Executive Officer, Frito-Lay North America 4 John C. Compton Chief Executive Officer, PepsiCo Americas Foods... -
Page 20
... In 2009, PepsiCo made a promise to deliver sustainable growth by investing in a healthier future for our consumers, our planet, our associates and our communities. Every day we deliver on this promise by striving to meet the goals and commitments we've made in four key areas: Performance, Human... -
Page 21
1-9 Performance To all our investors ...It's a promise to strive to deliver superior, sustainable financial performance. 20 PepsiCo, Inc. 2010 Annual Report -
Page 22
... Line 1 Grow international revenues at two times real global GDP growth rate. As the porld's second-largest food and beverage business, pe make, market or sell our products in more than 200 countries. In fact, more than 45 percent of our business comes from outside the U.S. In 2010, our revenues... -
Page 23
... the information to deepen consumer engagement, pe are able to adjust marketing plans and influence product innovation. Gatorade's Mission Control monitors, reacts and engages with consumers in real time across the social web, building awareness of the brand. 22 PepsiCo, Inc. 2010 Annual Report -
Page 24
.... In Canada, Frito-Lay pas ranked number three among a total of 23 fast-moving consumer goods companies in the grocery channel. Going forpard, pe plan to expand our Poper of One approach to a broader set of key customers and expect the efforts to translate into positive results in future surveys... -
Page 25
... long term. The 2010 acquisition of our anchor bottlers in North America and Europe, for example, enables us to drive gropth, ensure a dynamic future for PepsiCo and create a more integrated supply chain. As expected, the decision to acquire these bottlers reduced overall division operating margins... -
Page 26
... Corporate Governance and Values total cash returned to shareholders pas $29 billion. While delivering topquartile returns remains a goal pe continue to strive for, pe're proud that pe delivered above-average total shareholder returns among the top 15 global consumer product companies in 2010... -
Page 27
10-20 Human Sustainability To the people of the world ...It's a promise to encourage people to live healthier by offering a portfolio of both enjoyable and healthier foods and beverages. 26 PepsiCo, Inc. 2010 Annual Report -
Page 28
... formed our Global Nutrition Group, phich pe believe pill help us strive to become the leading provider of Good-for-You foods and beverages. This groundbreaking initiative is intended to help accelerate the gropth of our Good-for-You products from $10 billion in net revenue in 2010 to $30 billion by... -
Page 29
...are making good progress in reducing sodium in many of our key global food brands. In the U.K., Walkers has significantly reduced sodium by 25 to 55+ percent in its products since 2005, phile continuing to be the country's number one selling brand of crisps. In the U.S., Frito-Lay developed "Lightly... -
Page 30
... globe, including the U.S., Canada, Mexico and Brazil. (*) 15 Advertise to children under 12 only products that meet our global science-based nutrition standards. PepsiCo has taken a firm stand on responsible marketing to children by joining other global food and beverage manufacturers in adopting... -
Page 31
...-calorie beverage options. We also do not sell full-sugar soft drinks directly to primary and, in some cases, secondary schools in most of Europe, Canada, Australia and the majority of countries in the Arabian Peninsula. 17 Increase the range of foods and beverages that offer solutions for managing... -
Page 32
.... The Foundation's strong partnership pith Save the Children has reached approximately 850,000 people in India and Bangladesh to help improve health and nutrition. And the Foundation's partnership pith the World Food Program (WFP), phich leverages PepsiCo's supply chain expertise to improve the WFP... -
Page 33
21-35 Environmental Sustainability To the planet we all share ...It's a promise to be a good citizen of the world, protecting the Earth's natural resources through innovation and more efficient use of land, energy, water and packaging in our operations. 32 PepsiCo, Inc. 2010 Annual Report -
Page 34
... 2010, our global food and beverage businesses reduced pateruse intensity by 19.5 percent versus 2006. And pe're on track to achieve our 2015 target for company-opned facilities. Upgrading our facilities pith nep technologies is one important pay pe are reaching this goal. For example, our Frito-Lay... -
Page 35
... of rPET in countries outside the U.S. by more than 2.5 million pounds. 25 Create partnerships that promote the increase of U.S. beverage container recycling rates to 50 percent by 2018. We're creating national partnerships and developing nep technologies to 34 PepsiCo, Inc. 2010 Annual Report -
Page 36
... at public locations - such as grocery stores, gas stations, sports arenas, college campuses and schools - using intelligent kiosks equipped pith scanners. With these and other efforts, pe hope to PepsiCo's Dream Machine was developed to support PepsiCo's goal of increasing the U.S. beverage... -
Page 37
.... In 2010, 13 Frito-Lay North America manufacturing sites averaged less than 1 percent of solid paste disposed to landfill. In 2011, Frito-Lay North America expects that 20 facilities pill achieve this mark, and pe believe 10 facilities pill send zero paste to landfills by the end of the year. We... -
Page 38
...investment in electric-popered commercial trucks. In 2010, 13 electric Frito-Lay delivery trucks began their routes in the U.S. and Canada, pith another 163 scheduled for launch in 2011. We believe this pill make Frito-Lay the largest operator of all-electric private delivery trucks in North America... -
Page 39
... Management System is also driving route efficiency, productivity and cost savings. (*) 32 Apply proven sustainable agricultural practices on our farmed land. We've been committed to sustainable agriculture practices for many years. In 2009, pe launched our Global Sustainable Agriculture Policy... -
Page 40
... to sustainable development and nutrition. In 2011 and beyond, pe pill accelerate our efforts, engaging our internal team of experts to create an integrated framepork for company policies and practices that can be used to reach our goal and to serve as a basis for our Global Nutrition Group. Please... -
Page 41
36-47 Talent Sustainability To the associates of PepsiCo ...It's a promise to invest in our associates to help them succeed and develop the skills needed to drive the company's growth, while creating employment opportunities in the communities we serve. 40 PepsiCo, Inc. 2010 Annual Report -
Page 42
...20 26 29 At year-end, we had approximately 294,000 associates worldwide. a Our Board of Directors is pictured on page 17. b Composed of PepsiCo Executive Officers listed on page 18. c Includes full-time associates only. Executives, All Managers and All Associates are approximate numbers as of 12/25... -
Page 43
... wellness programs globally. Our global pellness strategy is designed to engage associates and their families in developing and sustaining healthy behaviors to improve their overall quality of life. To support associate pellness, pe offer on-site health and pellness services in many countries... -
Page 44
... increased the number of our manufacturing facilities, sales activities, associates and contractors porldpide. 40 Support ethical and legal compliance through annual training in our Code of Conduct, which outlines PepsiCo's unwavering commitment to its human rights policy to treat every associate... -
Page 45
... the Hay Group's 2010 ranking of the global top 20 "Best Companies for Leadership." In 2010, pe pere also recognized as a "Best Company for Leadership Development" in India by the Great Places to Work Institute. 43 Conduct training for associates from the front line to senior management, to ensure... -
Page 46
...in 2010, available to our associates globally. Meanphile, our operating groups continued to provide training for their frontline sales and operations teams. We pere pleased last year to be named by Actualidad Económica magazine as "One of the Best Companies in Spain" for investment in training. 45 -
Page 47
... Group, phich coordinated the efforts of nearly 1,400 associate volunteers in 30 food banks across the U.S. The Pepsi Refresh Project pill be expanding to additional markets (Europe, Latin America and the Middle East) in 2011. 47 Match eligible associate charitable contributions globally, dollar... -
Page 48
... Pension and Retiree Medical Plans Our Financial Results Items Affecting Comparability Results of Operations - Consolidated Review Results of Operations - Division Review Frito-Lay North America Quaker Foods North America Latin America Foods PepsiCo Americas Beverages Europe Asia, Middle East... -
Page 49
... annually. Our management monitors a variety of key indicators to evaluate our business results and financial conditions. These indicators include market share, volume, net revenue, operating profit, management operating cash flow, earnings per share and return on invested capital. Strategies... -
Page 50
...North America (FLNA), Quaker Foods North America (QFNA) and all of our Latin American food and snack businesses (LAF), including our Sabritas and Gamesa businesses in Mexico; 2) PepsiCo Americas Beverages (PAB), which includes PepsiCo Beverages Americas and Pepsi Beverages Company; 3) PepsiCo Europe... -
Page 51
...however, Europe operates its own bottling plants and distribution facilities. In addition, Europe licenses the Aquafina water brand to certain of its authorized bottlers. Europe also, either independently or through contract manufacturers, makes, markets and sells ready-to-drink tea products through... -
Page 52
... cooler equipment placement programs support the acquisition and placement of vending machines and cooler equipment. The nature and type of programs vary annually. Retail consolidation and the current economic environment continue to increase the importance of major customers. In 2010, sales to Wal... -
Page 53
...our advertising campaigns, marketing programs and product packaging. Although we devote significant resources to meet this goal, including the development of our Global Nutrition Group, there can be no assurance as to our continued ability to develop and launch successful new products or variants of... -
Page 54
... sales incentives and marketing programs to our customers could reduce our ability to secure adequate shelf space at our retailers and adversely affect our financial performance. Changes in the legal and regulatory environment could limit our business activities, increase our operating costs... -
Page 55
.... Fluctuations in foreign exchange rates may have an adverse impact on our business results or financial condition. We hold assets and incur liabilities, earn revenues and pay expenses in a variety of currencies other than the U.S. dollar. Because our consolidated financial statements are presented... -
Page 56
... from base strategies and objectives; and, with respect to acquisitions, our ability to successfully combine our businesses with the business of the acquired company in a manner that permits cost savings to be realized, including integrating the manufacturing, distribution, sales and administrative... -
Page 57
...• commodity prices, affecting the cost of our raw materials and energy; • foreign exchange rates; and • interest rates. In the normal course of business, we manage these risks through a variety of strategies, including productivity initiatives, global purchasing programs and hedging strategies... -
Page 58
...to forecasted debt transactions. Assuming year-end 2010 variable rate debt and investment levels, a 1-percentage-point increase in interest rates would have increased net interest expense by $43 million in 2010. Risk Management Framework The achievement of our strategic and operating objectives will... -
Page 59
... value requires significant estimates and assumptions based on an evaluation of a number of factors, such as marketplace participants, product life cycles, market share, consumer awareness, brand history and future expansion expectations, amount and timing of future cash flows and the discount rate... -
Page 60
... annually. Significant management judgment is necessary to evaluate the impact of operating and macroeconomic changes and to estimate future cash flows. Assumptions used in our impairment evaluations, such as forecasted growth rates and our cost of capital, are based on the best available market... -
Page 61
... that increase or decrease benefits for prior employee service (prior service cost/(credit)) is included in earnings on a straight-line basis over the average remaining service period of active plan participants. The health care trend rate used to determine our retiree medical plan's liability and... -
Page 62
... for pension and retiree medical expense are as follows: 2011 2010 2009 Our Financial Results Pension Expense discount rate Expected rate of return on plan assets Expected rate of salary increases Retiree medical Expense discount rate Expected rate of return on plan assets Current health care cost... -
Page 63
...recognized an asset impairment charge related to its business in Mexico. Consequently, a non-cash charge of $138 million was included in bottling equity income ($114 million after-tax or $0.07 per share) as part of recording our share of PBG's financial results. 62 PepsiCo, Inc. 2010 Annual Report -
Page 64
...2009, total servings increased slightly compared to 2008, as servings for snacks increased 1% while servings for beverages decreased 1%. Change 2010 2009 2008 2010 2009 Total net revenue Operating profit FLNA QFNA LAF PAB Europe AMEA Corporate Unallocated Mark-to-market net (gains/(losses)) Merger... -
Page 65
Management's Discussion and Analysis Other Consolidated Results Change 2010 2009 2008 2010 2009 Bottling equity income Interest expense, net Annual tax rate Net income attributable to PepsiCo Net income attributable to PepsiCo per common share - diluted Mark-to-market net (gains)/losses ... -
Page 66
... impact of our acquisitions of PBG and PAS from changes in our pre-existing beverage business since we now manage these businesses as an integrated system. Frito-Lay North America % Change 2010 2009 2008 2010 2009 Net revenue Impact of foreign currency translation Net revenue growth, on a constant... -
Page 67
... to our Productivity for Growth program, which increased operating profit growth by 5 percentage points. Lower advertising and marketing, and selling and distribution expenses, also contributed to the operating profit growth. Latin America Foods % Change 2010 2009 2008 2010 2009 Net revenue Impact... -
Page 68
PepsiCo Americas Beverages % Change 2010 2009 2008 2010 2009 Net revenue Impact of foreign currency translation Net revenue growth, on a constant currency basis* Operating profit Restructuring and impairment charges Merger and integration costs Inventory fair value adjustments Venezuela currency ... -
Page 69
... by higher commodity costs and increased investments in strategic markets. The net impact of acquisitions and divestitures reduced operating profit growth by 10 percentage points, primarily as a result of a one-time gain in the prior year associated with the contribution of our snacks business in... -
Page 70
...our U.S. pension plans, $196 million of restructuring payments related to our Productivity for Growth program and $49 million of merger cost payments related to our acquisitions of PBG and PAS. Operating cash flow also reflected net favorable working capital comparisons to 2008. Investing Activities... -
Page 71
...to return management operating cash flow to our shareholders through dividends and share repurchases while maintaining short-term credit ratings that ensure appropriate financial flexibility and ready access to global and capital credit markets at favorable interest rates. However, see "Our Business... -
Page 72
...per share amounts) Fiscal years ended December 25, 2010, December 26, 2009 and December 27, 2008 2010 2009 2008 Net Revenue Cost of sales Selling, general and administrative expenses Amortization of intangible assets Operating Profit Bottling equity income Interest expense Interest income Income... -
Page 73
... retiree medical plan expenses Bottling equity income, net of dividends Deferred income taxes and other tax charges and credits Change in accounts and notes receivable Change in inventories Change in prepaid expenses and other current assets Change in accounts payable and other current liabilities... -
Page 74
... Statement of Cash Flows (continued) PepsiCo, Inc. and Subsidiaries (in millions) Fiscal years ended December 25, 2010, December 26, 2009 and December 27, 2008 2010 2009 2008 Financing Activities Proceeds from issuances of long-term debt Payments of long-term debt Debt repurchase Short-term... -
Page 75
... PepsiCo, Inc. and Subsidiaries (in millions except per share amounts) December 25, 2010 and December 26, 2009 2010 2009 ASSETS Current Assets Cash and cash equivalents Short-term investments Accounts and notes receivable, net Inventories Prepaid expenses and other current assets Total Current... -
Page 76
...retiree medical (losses)/gains Reclassification of net losses to net income Unrealized gains/(losses) on securities, net of tax Other Balance, end of year Repurchased Common Stock Balance, beginning of year Share repurchases Stock option exercises Other Balance, end of year Total Common Shareholders... -
Page 77
... Balance, end of year Total Equity Comprehensive Income Net income Other Comprehensive Income/(Loss) Currency translation adjustment Cash flow hedges, net of tax Pension and retiree medical, net of tax: Net prior service credit/(cost) Net (losses)/gains Unrealized gains/(losses) on securities, net... -
Page 78
... accounting. See "Our Business Risks" and "Items Affecting Comparability" in Management's Discussion and Analysis of Financial Condition and Results of Operations. Raw materials, direct labor and plant overhead, as well as purchasing and receiving costs, costs directly related to production planning... -
Page 79
... in division results for North American employees. Division results also include interest costs, measured at a fixed discount rate, for retiree medical plans. Interest costs for the pension plans, pension asset returns and the impact of pension funding, and gains and losses other than those due... -
Page 80
... cash and cash equivalents, short-term investments, derivative instruments and property, plant and equipment. Total Assets FLNA QFNA 1% 9% 11% AMEA LAF 6% 8% Other 19% 46% PAB Capital Spending Corporate 7% AMEA 19% 16% Europe 16% FLNA QFNA 1% 11% LAF 30% PAB Europe 2010 2009 2008 2010 2009... -
Page 81
... revenue recognition and related policies, including our policy on bad debts, see "Our Critical Accounting Policies" in Management's Discussion and Analysis of Financial Condition and Results of Operations. We are exposed to concentration of credit risk by our customers, including Wal-Mart. In 2010... -
Page 82
... Critical Accounting Policies" in Management's Discussion and Analysis of Financial Condition and Results of Operations. • Stock-Based Compensation - Note 6. • Pension, Retiree Medical and Savings Plans - Note 7, and for additional unaudited information, see "Our Critical Accounting Policies" in... -
Page 83
... $ 2 Other Costs Total FLNA QFNA LAF PAB Europe AMEA $ - - 3 6 1 7 $17 $ 2 1 - 10 - 6 $19 $ 2 1 3 16 1 13 $36 Note 4 Property, Plant and Equipment and Intangible Assets Average Useful Life 2010 2009 2008 (a) Primarily reflects termination costs for approximately 410 employees. A summary of... -
Page 84
... next five years, based on existing intangible assets as of December 25, 2010 and using average 2010 foreign exchange rates, is expected to be $121 million in 2011, $114 million in 2012, $106 million in 2013, $89 million in 2014 and $81 million in 2015. Depreciable and amortizable assets are only... -
Page 85
...nondeductible goodwill Other Gross deferred tax liabilities Deferred tax assets Net carryforwards Stock-based compensation Retiree medical benefits Other employee-related benefits Pension benefits Deductible state tax and interest benefits Long-term debt obligations acquired Other Gross deferred tax... -
Page 86
... our annual benefits review in 2010, the Company approved certain changes to our benefits programs to remain market competitive relative to other leading global companies. These changes included ending the Company's broad-based SharePower stock option program. Consequently, beginning in 2011, no new... -
Page 87
... 11 years for pension expense and approximately eight years for retiree medical expense. The cost or benefit of plan changes that increase or decrease benefits for prior employee service (prior service cost/(credit)) is included in earnings on a straight-line basis over the average remaining service... -
Page 88
... financial statements. Selected financial information for our pension and retiree medical plans is as follows: Pension 2010 U.S. 2009 2010 2009 International Retiree Medical 2010 2009 Change in projected benefit liability Liability at beginning of year Acquisitions Service cost Interest cost Plan... -
Page 89
... Financial Statements Pension 2010 U.S. 2009 2010 2009 International Retiree Medical 2010 2009 Amounts recognized Other assets Other current liabilities Other liabilities Net amount recognized Amounts included in accumulated other comprehensive loss (pre-tax) Net loss Prior service cost/(credit... -
Page 90
...at year-end 2010, $747 million relates to plans that we do not fund because the funding of such plans does not receive favorable tax treatment. Future Benefit Payments and Funding Our estimated future benefit payments are as follows: 2011 2012 2013 2014 2015 2016-20 Pension Retiree medical(a) $480... -
Page 91
... management judgment. Plan assets measured at fair value as of fiscal year-end 2010 and 2009 are categorized consistently by level in both years, and are as follows: 2010* Total Level 1 Level 2 Level 3 2009 Total U.S. plan assets Equity securities: PepsiCo common stock(a) U.S. common stock... -
Page 92
... stock and approximately 7% of the equity of Bottling Group, LLC, PBG's principal operating subsidiary. PBG's summarized financial information is as follows: 2009 2008 2010 service and interest cost components 2010 benefit liability $ 5 $42 $ (4) $(50) Current assets Noncurrent assets Total... -
Page 93
... 2010 2009 Short-term debt obligations Current maturities of long-term debt Commercial paper (0.2%) Notes due 2011 (4.4%) Other borrowings (5.3% and 6.7%) Long-term debt obligations Notes due 2012 (3.1% and 1.9%) Notes due 2013 (3.0% and 3.7%) Notes due 2014 (5.3% and 4.0%) Notes due 2015... -
Page 94
... at least to the extent of our borrowings. Payments Due by Period Total 2011 2012-2013 2014-2015 2016 and beyond Long-term debt obligations(b) Interest on debt obligations(c) Operating leases Purchasing commitments Marketing commitments $19,337 7,746 1,676 2,433 824 $32,016 - 809 390 765... -
Page 95
... Financial Instruments We are exposed to market risks arising from adverse changes in: • commodity prices, affecting the cost of our raw materials and energy, • foreign exchange risks, and • interest rates. In the normal course of business, we manage these risks through a variety of strategies... -
Page 96
...of $26 million in 2010 and net losses of $57 million in 2009. Foreign Exchange Financial statements of foreign subsidiaries are translated into U.S. dollars using period-end exchange rates for assets and liabilities and weighted-average exchange rates for revenues and expenses. Adjustments resulting... -
Page 97
... value due to the short-term maturity. Short-term investments consist principally of short-term time deposits and index funds used to manage a portion of market risk arising from our deferred compensation liability. The fair value of our debt obligations as of December 25, 2010 and December 26, 2009... -
Page 98
...by the ESOP participants. The preferred stock accrues dividends at an annual rate of $5.46 per share. At year-end 2010 and 2009, there were 803,953 preferred shares issued and 227,653 and 243,553 shares outstanding, respectively. The outstanding preferred shares had a fair value of $74 million as of... -
Page 99
... 14 Supplemental Financial Information 2010 2009 2008 Accounts receivable Trade receivables Other receivables Allowance, beginning of year Net amounts charged to expense Deductions(a) Other(b) Allowance, end of year Net receivables Inventories(c) Raw materials Work-in-process Finished goods $5,514... -
Page 100
...fully integrated supply chain and go-to-market business model, improving the effectiveness and efficiency of the distribution of our brands and enhancing our revenue growth. The total purchase price was approximately $12.6 billion, which included $8.3 billion of cash and equity and the fair value of... -
Page 101
... rights Other current assets and current liabilities(a) Other noncurrent assets Debt obligations Pension and retiree medical benefits Other noncurrent liabilities Deferred income taxes Total identifiable net assets Goodwill Subtotal Fair value of acquisition of noncontrolling interest Total purchase... -
Page 102
... excess of the purchase price paid over the net assets recognized. The goodwill recorded as part of the acquisitions of PBG and PAS primarily reflects the value of adding PBG and PAS to PepsiCo to create a more fully integrated supply chain and go-to-market business model, as well as any intangible... -
Page 103
... in all countries. We have maintained strong governance policies and practices for many years. The management of PepsiCo is responsible for the objectivity and integrity of our consolidated financial statements. The Audit Committee of the Board of Directors has engaged independent registered public... -
Page 104
..., or are reasonably likely to materially affect, our internal control over financial reporting. February 18, 2011 Peter A. Bridgman Senior Vice President and Controller Hugh F. Johnston Chief Financial Officer Indra K. Nooyi Chairman of the Board of Directors and Chief Executive Officer 103 -
Page 105
... "the Company") as of December 25, 2010 and December 26, 2009, and the related Consolidated Statements of Income, Cash Flows and Equity for each of the fiscal years in the three-year period ended December 25, 2010. We also have audited PepsiCo, Inc.'s internal control over financial reporting as of... -
Page 106
...an additional $11 million of costs in bottling equity income representing our share of the respective merger costs of PBG and PAS. In total, these costs had an after-tax impact of $44 million or $0.03 per share. See Note 3. (c) In 2010, in connection with our acquisitions of PBG and PAS, we recorded... -
Page 107
... 2010 2009 2008 2007 2006 Net revenue Net income attributable to PepsiCo Net income attributable to PepsiCo per common share âˆ' basic Net income attributable to PepsiCo per common share âˆ' diluted Cash dividends declared per common share Total assets Long-term debt Return on invested capital... -
Page 108
...December 25, 2010, we recorded $9 million of charges, representing our share of the respective merger costs of PBG and PAS, recorded in bottling equity income. In the year ended December 26, 2009, we incurred $50 million of costs associated with the mergers with PBG and PAS, as well as an additional... -
Page 109
... Capital Spending Sales of Property, Plant and Equipment Management Operating Cash Flow Discretionary Pension and Retiree Medical Contributions (after-tax) Payments Related to 2009 Restructuring Charges (after-tax) Merger and Integration Payments (after-tax) Foundation Contribution (after-tax) Debt... -
Page 110
... independent bottlers, distributors and retailers. Derivatives: financial instruments, such as futures, swaps, Treasury locks, options and forward contracts, that we use to manage our risk arising from changes in commodity prices, interest rates, foreign exchange rates and stock prices. Direct-Store... -
Page 111
... PepsiCo stock. This performance represents a compounded annual growth rate of 4.6 percent. Cash Dividends Declared Per Share (in $) 10 09 08 07 06 1.89 1.775 1.65 1.425 1.16 Shareholder Information Annual Meeting The Annual Meeting of Shareholders will be held at Frito-Lay Corporate headquarters... -
Page 112
..., direct deposit of dividends, optional cash investments by electronic funds transfer or check drawn on a U.S. bank, sale of shares, online account access and electronic delivery of shareholder materials. Financial and Other Information PepsiCo's 2011 quarterly earnings releases are expected to... -
Page 113