Peachtree 2013 Annual Report Download - page 5
Download and view the complete annual report
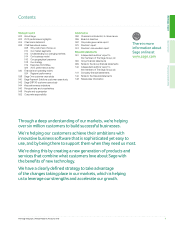
Please find page 5 of the 2013 Peachtree annual report below. You can navigate through the pages in the report by either clicking on the pages listed below, or by using the keyword search tool below to find specific information within the annual report.-
 1
1 -
 2
2 -
 3
3 -
 4
4 -
 5
5 -
 6
6 -
 7
7 -
 8
8 -
 9
9 -
 10
10 -
 11
11 -
 12
12 -
 13
13 -
 14
14 -
 15
15 -
 16
16 -
17
-
18
-
19
-
20
-
21
-
22
-
23
-
24
-
25
-
26
-
27
-
28
-
29
-
30
-
31
-
32
-
33
-
34
-
35
-
36
-
37
-
38
-
39
-
40
-
41
-
42
-
43
-
44
-
45
-
46
-
47
-
48
-
49
-
50
-
51
-
52
-
53
-
54
-
55
-
56
-
57
-
58
-
59
-
60
-
61
-
62
-
63
-
64
-
65
-
66
-
67
-
68
-
69
-
70
-
71
-
72
-
73
-
74
-
75
-
76
-
77
-
78
-
79
-
80
-
81
-
82
-
83
-
84
-
85
-
86
-
87
-
88
-
89
-
90
-
91
-
92
-
93
-
94
-
95
-
96
-
97
-
98
-
99
-
100
-
101
-
102
-
103
-
104
-
105
-
106
-
107
-
108
-
109
-
110
-
111
-
112
-
113
-
114
-
115
-
116
-
117
-
118
-
119
-
120
-
121
-
122
-
123
-
124
-
125
-
126
-
127
-
128
-
129
-
130
-
131
-
132
-
133
-
134
-
135
-
136
-
137
-
138
-
139
-
140
-
141
-
142
-
143
-
144
-
145
-
146
-
147
-
148
-
149
-
150
-
151
-
152
 |
 |

Note:
* The 2012 Annual Report & Accounts disclosed Sage One paying customers of 6,100. This year we are reporting the number of paying subscriptions.
Definitions of underlying measures:
– Organic revenue neutralises the impact of foreign exchange in prior year figures and excludes the contribution of current and prior year acquisitions
and disposals.
– Underlying revenue neutralises the impact of foreign exchange in prior year figures.
– Underlying operating profit (“EBITA”) excludes amortisation of acquired intangible assets, acquisition-related items, goodwill impairment, fair value
adjustments and exceptional items that include a £188.2m exceptional charge primarily relating to non-core disposals. The impact of foreign
exchange is neutralised in prior year figures. EBITA is divided into underlying revenue to derive EBITA margin.
– Underlying basic earnings per share is defined as underlying profit divided by the weighted average number of ordinary shares in issue during the year,
excluding those held as treasury shares. Underlying profit is defined as profit attributable to owners of the parent excluding amortisation of intangible
assets, acquisition-related items, goodwill impairment, fair value adjustments, exceptional items and imputed interests. All of these adjustments are net
of tax. The impact of foreign exchange is neutralised in prior year figures.
– Underlying cash conversion is calculated as cash flows from operating activities, adjusted for cash acquisition-related items and cash exceptional
items of £1.9m (2012: £nil), divided by EBITA.
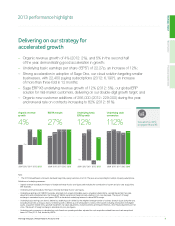
Delivering on our strategy for
accelerated growth
–Organic revenue growth of 4% (2012: 2%), and 5% in the second half
of the year, demonstrating good acceleration in growth;
–Underlying basic earnings per share (“EPS”) of 22.27p, an increase of 12%;
–Strong acceleration in adoption of Sage One, our cloud solution targeting smaller
businesses, with 22,400 paying subscriptions (2012: 6,190*), an increase
of more than three-fold in 12 months;
–Sage ERP X3 underlying revenue growth of 12% (2012: 5%), our global ERP
solution for mid-market customers, delivering on our double-digit growth target; and
–Organic new customer additions of 256,000 (2012: 229,000) during the year,
and renewal rate on contracts increasing to 82% (2012: 81%).
2013 performance highlights
20112009 2010 2012 2013
Organic revenue
growth
4%
-5%
Flat
4%
2%
4
%
20112009 2010 2012 2013
EBITA margin
27
%
27%
27%
27%
25%
22%
Flat
20112009 2010 2012 2013
Underlying basic
EPS growth
12%
14%
16%
-2%
1
2%
111%
20112009 2010 2012 2013
Underlying cash
conversion
1
12%
106
%
111%
117%
112%
112%
View all of our KPIs
on pages 44 and 45
3The Sage Group plc | Annual Report & Accounts 2013
Financial statementsGovernanceStrategic report