Omron 2009 Annual Report Download - page 21
Download and view the complete annual report
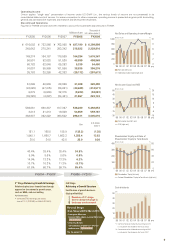
Please find page 21 of the 2009 Omron annual report below. You can navigate through the pages in the report by either clicking on the pages listed below, or by using the keyword search tool below to find specific information within the annual report.-
 1
1 -
2
-
3
-
4
-
5
-
6
-
7
-
8
-
9
-
10
-
 11
11 -
 12
12 -
 13
13 -
 14
14 -
 15
15 -
 16
16 -
 17
17 -
 18
18 -
 19
19 -
 20
20 -
 21
21 -
 22
22 -
 23
23 -
 24
24 -
 25
25 -
 26
26 -
 27
27 -
 28
28 -
 29
29 -
 30
30 -
 31
31 -
32
-
33
-
34
-
35
-
36
-
37
-
38
-
39
-
40
-
41
-
42
-
43
-
44
-
45
-
46
-
47
-
48
-
49
-
50
-
51
-
52
-
53
-
54
-
55
-
56
-
57
-
58
-
59
-
60
-
61
-
62
-
63
-
64
-
65
-
66
-
67
-
68
-
69
-
70
-
71
-
72
-
73
-
74
-
75
-
76
-
77
-
78
-
79
-
80
-
81
-
82
-
83
-
84
-
85
-
86
-
87
-
88
-
89
-
90
-
91
-
92
-
93
-
94
-
95
-
96
 |
 |

19
What are the Company’s policies
regarding capital, such as its share-
holder return and financial policies?
Q
Reinforcing Our Defense with Loans and
Improving Cash Flow
Omron’s policy on the distribution of profits is to pro-
vide the maximum amount possible to shareholders
from the Company’s surplus cash account after deter-
mining that sufficient funds are maintained for internal
reserves for essential R&D, capital investment, and
other business growth-related investment, and in con-
sideration of the current level of free cash flow. Our
policy is to maintain a minimum 20% dividend payout
ratio and to target 2% dividend on equity (DOE) ratio.
In fiscal 2008, taking into consideration the result
of a ¥29.2 billion net loss, we distributed ordinary div-
idends of ¥25 per share, representing a ¥17 decrease
from the previous fiscal year and a DOE ratio of 1.7%.
We have not yet set the dividend rate for fiscal 2009 as
we feel it is prudent to wait until we have a better idea
of how business conditions will develop and how the
Company is progressing toward its forecast targets in
this environment.
Our financial policy at present is to preserve our
cash holdings to ensure we are fully prepared for unan-
ticipated contingencies. In fiscal 2008, we secured
approximately ¥20 billion in long-term loans for this
purpose. In fiscal 2009, we plan to improve total cash
flow by approximately ¥25 billion by lowering inven-
tories (¥15 billion) and reducing capital investment
(¥10 billion). In accordance with the anticipated ongo-
ing decline in sales in fiscal 2009, we plan to reduce
How will Omron be changed when it emerges from this difficult period?
Q
Operating Income of ¥100 Billion when Sales
Recover to ¥750 Billion
When we reached our high point for operating
income—¥65.3 billion in fiscal 2007— the Company
had been in business for 75 years. For fiscal 2009, a
mere two years later, we are challenging ourselves to
attain positive zero operating income. Nevertheless,
as we discussed earlier, we are approaching this as
“positive zero” because it will represent a significant
structural reform achievement.
We plan to steadily reinforce our profit structure
and substantially lower our breakeven sales point as
foundational steps for the Company’s future. Our spe-
cific goal is to reform and improve our profit structure
so that when we raise sales back to the ¥750 billion
level achieved in fiscal 2007, our profit structure will
yield operating income not of ¥65.3 billion but sur-
passing ¥100 billion.
The Omron Group is not content to bow our heads
and wait for the storm to blow over. We are forging
ahead with our heads held high as we put into prac-
tice our motto— “Change! Challenge! Create!”
Strengthen Profit Base in the Medium Term
2007
(Actual)
2008
(Actual)
2009
(Planned)
201
X
(Target)
Mainly through
emergency
measures
(Billions of yen)
(FY)
Net sales Operating income
100.0
65.3
5.3 +0
750.0
763.0
627.2
510.0
Mainly through
structural
reform
Approx. JPY 60 bn
improvement
Maintain BEP of
approx. JPY 500 bn
in sales by
restricting/offsetting
fixed costs
increase and reducing
variable cost ratio
8.8
-2.0
3.3
0.8
10.5
10.3
Depreciation Expense and Capital Investment
04 05 06 07 08 09
Initial Plan
(Billions of yen)
(FY)
Net Capital
Investment
Capital
Investment
Depreciation
Expense
37.4 41.1 44.4 37.1
33.5
36.3
33.9
30.8
28.6
27.0
36.8
25.0
R&D expenses by ¥8.9 billion and reduce the propor-
tion of R&D expenses to sales down to 7.8%.
Investment in R&D is directly related to investment
in business growth and is not usually an area where
we would want to economize. Given the current eco-
nomic environment, however, we are concentrating
R&D spending on fortifying our competitiveness in
mechanical components and in specific fields with
strong growth potential, particularly MEMS and envi-
ronmental businesses.