Omron 2009 Annual Report Download - page 11
Download and view the complete annual report
Please find page 11 of the 2009 Omron annual report below. You can navigate through the pages in the report by either clicking on the pages listed below, or by using the keyword search tool below to find specific information within the annual report.
FY2008∼FY2010
2nd Stage Balancing Growth & Earnings
Reinforcing business foundations through
aggressive investment in growth areas,
such as M&A, and cost cutting.
Achievements
• Increased EPS (earnings per share)
from ¥110.7 (FY2003) to ¥185.9 (FY2007).
FY2004∼FY2007
Revision of 3rd stage
due to abrupt change in
business environment
3rd Stage
Achieving a Growth Structure
Fortification of growth business
(high profitability)
Revival Stage
(from February 2009 to March 2011)
• Emergency Measures
(In fiscal 2009, reduce costs by ¥60 billion)
• Structural Reform
(Strengthening of profit base over the
medium term)
Go to page 14
26 months
14 months
Millions of yen
Thousands of
U.S. dollars (note 1)
Operating Income
Omron applies “single step” presentation of income under US GAAP (i.e., the various levels of income are not presented) in its
consolidated statements of income. For easier comparison to other companies, operating income is presented as gross profit less selling,
general and administrative expenses and research and development expenses.
Discontinued Operations
Figures for FY2002 onward have been restated to account for businesses discontinued in FY2007.
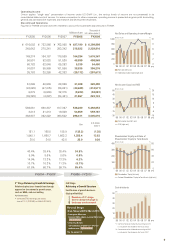
02010099 03 04 05 06 07 08
Billions of yen %
(FY)
Net Sales and Operating Income Margin
Net sales [left axis]
Operating income margin [right axis]
0
200
400
600
800
1,000
0
2
4
6
8
10
(FY)
02010099 03 04 05 06 07 08
Billions of yen %
Net Income (Loss) and ROE
Net income (loss) [left axis]
ROE [right axis]
-30
-15
0
15
30
45
60
-10
-5
0
5
10
15
20
(FY)
Shareholders’ Equity [left axis]
Ratio of Shareholders’ Equity to Total Assets [right axis]
02010099 03 04 05 06 07 08
Billions of yen %
Shareholders’ Equity and Ratio of
Shareholders’ Equity to Total Assets
0
100
200
300
400
0
20
40
60
80
02010099 03 04 05 06 07
*2
*1
08
yen
Cash dividends
(FY)
0
10
20
30
40
50
FY2005
¥ 616,002
248,642
149,274
50,501
60,782
91,607
35,763
51,699
(43,020)
8,679
(38,320)
589,061
3,813
362,937
151.1
1,548.1
30.0
40.4%
9.9%
14.9%
10.7%
61.6%
FY2006
¥ 723,866
278,241
164,167
52,028
62,046
95,969
38,280
40,539
(47,075)
(6,536)
(4,697)
630,337
21,813
382,822
165.0
1,660.7
34.0
38.4%
8.6%
13.3%
10.3%
60.7%
FY2007
¥ 762,985
293,342
176,569
51,520
65,253
101,596
42,383
68,996
(36,681)
32,315
(34,481)
617,367
19,809
368,502
185.9
1,662.3
42.0
38.4%
8.6%
13.3%
11.3%
59.7%
FY2008
¥ 627,190
218,522
164,284
48,899
5,339
38,835
(29,172)
31,408
(40,628)
(9,220)
21,867
538,280
54,859
298,411
(132.2)
1,355.4
25.0
34.8%
0.9%
6.2%
(8.7%)
55.4%
FY2008
$ 6,399,898
2,229,816
1,676,367
498,969
54,480
396,276
(297,673)
320,490
(414,571)
(94,081)
223,133
5,492,653
559,787
3,045,010
(1.35)
13.83
0.26
U.S. dollars
(note 1)
Yen
9
*1. Commemorative dividend amounting to ¥7.0
is included in the dividends for fiscal 2003.
*2. Commemorative dividend amounting to ¥5.0
is included in the dividends for fiscal 2007.

