Omron 2009 Annual Report Download - page 10
Download and view the complete annual report
Please find page 10 of the 2009 Omron annual report below. You can navigate through the pages in the report by either clicking on the pages listed below, or by using the keyword search tool below to find specific information within the annual report.-
 1
1 -
 2
2 -
 3
3 -
 4
4 -
 5
5 -
 6
6 -
 7
7 -
 8
8 -
 9
9 -
 10
10 -
 11
11 -
 12
12 -
 13
13 -
 14
14 -
 15
15 -
 16
16 -
 17
17 -
 18
18 -
 19
19 -
 20
20 -
 21
21 -
22
-
23
-
24
-
25
-
26
-
27
-
28
-
29
-
30
-
31
-
32
-
33
-
34
-
35
-
36
-
37
-
38
-
39
-
40
-
41
-
42
-
43
-
44
-
45
-
46
-
47
-
48
-
49
-
50
-
51
-
52
-
53
-
54
-
55
-
56
-
57
-
58
-
59
-
60
-
61
-
62
-
63
-
64
-
65
-
66
-
67
-
68
-
69
-
70
-
71
-
72
-
73
-
74
-
75
-
76
-
77
-
78
-
79
-
80
-
81
-
82
-
83
-
84
-
85
-
86
-
87
-
88
-
89
-
90
-
91
-
92
-
93
-
94
-
95
-
96
 |
 |

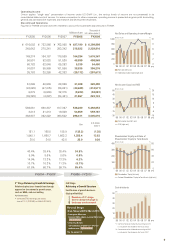
Grand Design 2010 (GD2010)
Long-term corporate vision
(FY2001∼FY2010)
FY2001∼FY2003
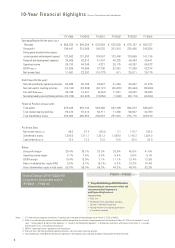
Notes: 1. U.S. dollar amounts represent translations of Japanese yen at the approximate exchange rate on March 31, 2009, of ¥98=$1.
2. Profit or loss (excluding the balance of obligation settled) recognized on the transfer of employee pension fund liabilities in March 31, 2006 is not included in “cost of
sales,” “selling, general & administrative expenses,” or “research and development expenses,” to enable easy comparison with previous fiscal years. It is assumed
that this profit or loss is allocated in one lump sum.
3. EBITDA = Operating income + depreciation and amortization.
4. Free cash flow = Net cash provided by operating activities + net cash used in investing activities.
5. Cash dividends per share represent the amounts applicable to the respective year, including dividends to be paid after the end of the year.
1st Stage Establishing a Profit Structure
Concentrating on cost structure reform and
restructuring the Company as a
profit-generating business.
Achievements
• ROE 10%
• Withdrawal from unprofitable business,
spin off of Healthcare business.
• Raising the level of corporate governance
to the global standard.
Operating Results (for the year): (note 2)
Net sales
Gross profit
Selling, general and administrative expenses
(excluding research and development expenses)
Research and development expenses
Operating income
EBITDA (note 3)
Net income (loss)
Cash Flows (for the year):
Net cash provided by operating activities
Net cash used in investing activities
Free cash flow (note 4)
Net cash provided by (used in) financing activities
Financial Position (at year end):
Total assets
Total interest-bearing liabilities
Total shareholders’ equity
Per Share Data:
Net income (loss) (basic)
Shareholders’ equity
Cash dividends (note 5)
Ratios:
Gross profit margin
Operating income margin
EBITDA margin
Return on shareholders’ equity (ROE)
Ratio of shareholders’ equity to total assets
10-Year Financial Highlights Omron Corporation and Subsidiaries
FY1999
¥ 555,358
196,447
133,662
36,605
26,180
57,625
11,561
59,926
(34,180)
25,746
(23,785)
579,489
69,472
336,062
45.0
1,308.6
13.0
35.4%
4.7%
10.4%
3.5%
58.0%
FY2000
¥ 594,259
218,065
131,203
42,513
44,349
76,566
22,297
50,796
(32,365)
18,431
(24,582)
593,144
67,213
325,958
87.4
1,311.1
13.0
36.7%
7.5%
12.9%
6.7%
55.0%
FY2001
¥ 533,964
180,535
134,907
41,407
4,221
37,790
(15,773)
33,687
(40,121)
(6,434)
(12,056)
549,366
58,711
298,234
(63.5)
1,201.2
13.0
33.8%
0.8%
7.1%
(5.1%)
54.3%
FY2002
¥ 522,535
201,816
133,406
40,235
28,175
57,851
511
41,854
(30,633)
11,221
(1,996)
567,399
71,260
251,610
2.1
1,036.0
10.0
38.6%
5.4%
11.1%
0.2%
44.3%
FY2003
¥ 575,157
235,460
139,569
46,494
49,397
77,059
26,811
80,687
(34,484)
46,203
(28,119)
592,273
56,687
274,710
110.7
1,148.3
20.0
40.9%
8.6%
13.4%
10.2%
46.4%
FY2004
¥ 598,727
245,298
141,185
49,441
54,672
83,314
30,176
61,076
(36,050)
25,026
(40,684)
585,429
24,759
305,810
126.5
1,284.8
24.0
41.0%
9.1%
13.9%
10.4%
52.2%
8