Omron 2005 Annual Report Download - page 7
Download and view the complete annual report
Please find page 7 of the 2005 Omron annual report below. You can navigate through the pages in the report by either clicking on the pages listed below, or by using the keyword search tool below to find specific information within the annual report.-
 1
1 -
 2
2 -
 3
3 -
 4
4 -
 5
5 -
 6
6 -
 7
7 -
 8
8 -
 9
9 -
 10
10 -
 11
11 -
 12
12 -
 13
13 -
 14
14 -
 15
15 -
 16
16 -
 17
17 -
 18
18 -
19
-
20
-
21
-
22
-
23
-
24
-
25
-
26
-
27
-
28
-
29
-
30
-
31
-
32
-
33
-
34
-
35
-
36
-
37
-
38
-
39
-
40
-
41
-
42
-
43
-
44
-
45
-
46
-
47
-
48
-
49
-
50
-
51
-
52
-
53
-
54
-
55
-
56
-
57
-
58
-
59
-
60
-
61
-
62
-
63
-
64
-
65
-
66
-
67
-
68
-
69
-
70
-
71
-
72
-
73
-
74
-
75
-
76
-
77
-
78
-
79
-
80
 |
 |

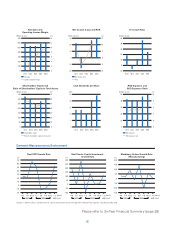
5
01/3 02/3 03/3 04/3 05/3
Net Sales and
Operating Income Margin
700
600
500
100
200
300
400
0
14
12
10
2
4
6
8
0
(Billions of yen) (%)
Net sales
Operating income margin
01/3 02/3 03/3 04/3 05/3
Net Income (Loss) and ROE
30
20
-10
0
10
-20
15
10
-5
0
5
-10
(Billions of yen) (%)
Net income (loss)
ROE
01/3 02/3 03/3 04/3 05/3
Free Cash Flow
50
40
0
10
20
30
-10
(Billions of yen)
01/3 02/3 03/3 04/3 05/3
Shareholders’ Equity and
Ratio of Shareholders’ Equity to Total Assets
350
300
250
50
100
200
150
0
70
60
10
30
40
20
50
0
(Billions of yen) (%)
Shareholders’ equity
Ratio of shareholders’ equity to total assets
01/3 02/3 03/3 04/3 05/3
Cash Dividends per Share
25
20
15
5
10
0
(Yen)
01/3 02/3 03/3 04/3 05/3
R&D Expenses and
R&D Expenses Ratio
50
40
10
20
30
0
10
9
6
7
8
5
(Billions of yen) (%)
R&D expenses
R&D expenses ratio
Domestic Macroeconomic Environment
4-6
2003 2004 2005 2003 2004 2005 2003 2004 2005
7-9 10-12 1-3 4-6 7-9 10-12 1-3
Real GDP Growth Rate
(%)
Machinery Orders Growth Rate
(Manufacturing)
20.0
15.0
10.0
-10.0
-5.0
0
5.0
-15.0
(%)
Real Private Capital Investment
Growth Rate
(%)
4-6 7-9 10-12 1-3 4-6 7-9 10-12 1-3 4-6 7-9 10-12 1-3 4-6 7-9 10-12 1-3
Source: Cabinet Office, Government of Japan (annualized rate of change from the previous quarter, seasonally adjusted)
(month)
(year)
(month)
(year)
(month)
(year)
7.0
6.0
5.0
1.0
0
-1.0
2.0
3.0
4.0
-2.0
30.0
25.0
20.0
0
-5.0
5.0
10.0
15.0
-10.0
Please refer to Six-Year Financial Summary (page 38)