Omron 2005 Annual Report Download - page 21
Download and view the complete annual report
Please find page 21 of the 2005 Omron annual report below. You can navigate through the pages in the report by either clicking on the pages listed below, or by using the keyword search tool below to find specific information within the annual report.-
 1
1 -
2
-
3
-
4
-
5
-
6
-
7
-
8
-
9
-
10
-
 11
11 -
 12
12 -
 13
13 -
 14
14 -
 15
15 -
 16
16 -
 17
17 -
 18
18 -
 19
19 -
 20
20 -
 21
21 -
 22
22 -
 23
23 -
 24
24 -
 25
25 -
 26
26 -
 27
27 -
 28
28 -
 29
29 -
 30
30 -
 31
31 -
32
-
33
-
34
-
35
-
36
-
37
-
38
-
39
-
40
-
41
-
42
-
43
-
44
-
45
-
46
-
47
-
48
-
49
-
50
-
51
-
52
-
53
-
54
-
55
-
56
-
57
-
58
-
59
-
60
-
61
-
62
-
63
-
64
-
65
-
66
-
67
-
68
-
69
-
70
-
71
-
72
-
73
-
74
-
75
-
76
-
77
-
78
-
79
-
80
 |
 |

Solution Service Business for SMT Process Improvement
This solution service promotes minimization of losses
caused by mounting errors and introduction of lead-free
technology in SMT process through providing the customers
with printed circuit board inspection systems, and software
for defective analysis and/or lead-free introduction, as well
as consulting services.
Safety Network Controller type NEIA-SCPU01
This is the world’s first controller with the DeviceNet
Safety interface built in, meeting the world’s highest
safety standards.
Smart Sensor type ZFV
This sensor is the fastest shape measurement sensor in the
industry. It has a super fast response time making it possi-
ble to handle high-speed production lines.
19
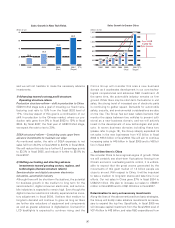
IAB RESULTS AND PLANS Billions of yen
FY2005 Plan FY2004 Y o Y FY2003 FY2002
Net sales* 267.5 250.3 109.0% 229.6 202.5
Domestic 135.5 130.2 111.1% 117.1 102.2
Overseas 132.0 120.1 106.8% 112.5 100.3
North America 21.1 20.3 103.9% 19.6 19.9
Europe 70.3 65.6 108.2% 60.7 53.0
Asia 11.5 10.4 76.3% 13.6 12.1
China 24.8 19.5 105.9% 18.4 15.0
Direct exports 4.3 4.3 1672.1% 0.3 0.3
Operating income* 42.0 41.4 121.2% 34.2 24.1
Operating income margin* 15.7% 16.5% +1.6 pt. 14.9% 11.9%
R&D expenses 17.5 16.7 114.8% 14.5 13.4
Depreciation and amortization
7.7 7.6 76.4% 10.0 8.7
Capital expenditures 10.0 8.8 120.4% 7.3 8.0
* Projections for FY2005 are based on an exchange rate of ¥100/US$ and ¥130/Euro.
*The sales figures given indicate sales to external customers and exclude intersegment transactions. Operating income indicates income
including internal income prior to the deduction of amounts such as intersegment transactions and headquarters expenses that are not
apportionable.
Sales Breakdown,
by Product
(Fiscal 2004 Actual)
Industrial Equipment 40%
(Power supplies, Temperature controllers,
Control relays, Timers, Switches etc.)
System Equipment 33%
(PLCs, Inverters, Motion controllers etc.)
Sensors 27%
(Application sensors, Photoelectric sensors,
Proximity sensors etc.)
Solution Service Business for SMT Process Improvement
This solution service promotes minimization of losses
caused by mounting errors and introduction of lead-free
technology in the SMT process through providing customers
with printed circuit board inspection systems and software
for defect analysis and/or introduction of lead-free technol-
ogy, as well as consulting services.
Core IAB Products