Omron 2005 Annual Report Download - page 19
Download and view the complete annual report
Please find page 19 of the 2005 Omron annual report below. You can navigate through the pages in the report by either clicking on the pages listed below, or by using the keyword search tool below to find specific information within the annual report.-
 1
1 -
2
-
3
-
4
-
5
-
6
-
7
-
8
-
 9
9 -
 10
10 -
 11
11 -
 12
12 -
 13
13 -
 14
14 -
 15
15 -
 16
16 -
 17
17 -
 18
18 -
 19
19 -
 20
20 -
 21
21 -
 22
22 -
 23
23 -
 24
24 -
 25
25 -
 26
26 -
 27
27 -
 28
28 -
 29
29 -
30
-
31
-
32
-
33
-
34
-
35
-
36
-
37
-
38
-
39
-
40
-
41
-
42
-
43
-
44
-
45
-
46
-
47
-
48
-
49
-
50
-
51
-
52
-
53
-
54
-
55
-
56
-
57
-
58
-
59
-
60
-
61
-
62
-
63
-
64
-
65
-
66
-
67
-
68
-
69
-
70
-
71
-
72
-
73
-
74
-
75
-
76
-
77
-
78
-
79
-
80
 |
 |

17
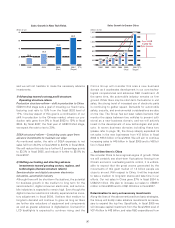
Operating income*(billions of yen) and Main Products and Services
Operating income margin*(%)
•Control Relays (Relays, Timers, Counters, etc.)
•Control Switches (Limit Switches, Micro Switches, Manipulate Switches, etc.)
•Control Devices (Temperature Controllers, Power Supplies, Level Controllers, Protective Devices, Digital Power
Meters, Transmission Units, Wireless Units, Energy-Saving Devices, etc.)
•Sequence Control Equipment (PLCs, Industrial Networking Equipment, Programmable Terminals, Application Software, etc.)
•Motion Controllers (Inverters, Servo Motors, etc.)
•Sensors (Photoelectric Sensors, Proximity Sensors, Displacement Sensors, Pressure Sensors, Ultrasound Sensors,
Measurement Sensors, Vision Sensors, Visual Components, Information Sensing Equipment, etc.)
•Inspection Systems (PCB Inspection Systems, Sheet Inspection Systems, etc.)
•Safety-Related Devices (Safety Relays, Door Switches, Safety Controller, Area Sensors, Safety Mats, etc.)
• Switches (Micro Switches, Tactile Switches, Trigger Switches, etc.)
• Relays (General-Purpose Relays, PCB Relays, relays for telecommunications equipment, etc.)
• Amusement Components, Units and Systems (Sensors, Keys, ICs, IC Coin Systems, etc.)
• Connectors, Sensors for Consumer, Micro Lens Alleys
• Components for Printers and Photocopiers (Toner Sensors, Facial Recognition Systems Software Components, etc.)
• Components for Mobile Equipment (Backlights and Flash Lights for Mobile Phones, etc.)
• Various Automotive Relays, Switches, Keyless Entry Systems, Power Window Switches, Electric Power Steering
Controllers, Various Controllers, Laser Radar Devices, etc.
• Electronic Fund Transfer Systems and Modules (Automated Teller Machines, Cash Dispensers, Automated Bill
Changers, Automated Loan Application Machines, Credit/Debit Card Transaction Terminals, etc.)
• Public Transportation Systems and Modules (Automated Ticket Venders, Automated Passenger Gates, Automated
Fare Adjustment Systems, Commuter Ticket Issuing Machines, Ticket Window Machines, etc.)
• Traffic and Road Management Systems (Traffic Management Systems, Vehicle Information and Communication
Systems, Travel Time Measurement Systems, Public Transportation Priority Systems, etc.)
• Room Access Control Systems, Facial Recognition Systems, Card Readers/Writers
• Circulatory System Devices and Bio-Chemistry System Devices (Blood Pressure Monitors for home use, Blood Pres-
sure Monitors for professional use)
• Obesity Solution Devices (Body Composition Monitor, Pedometer)
• Lifestyle Improvement Programs (“Kenko Tatsujin”, “Kenko partner”)
• Other Medical and Healthcare Devices (Thermometer, Massager, Nebulizer)
• Personal Computer Peripherals (ADSL Modems, Broadband Routers, Uninterruptible Power Supplies, etc.)
• RFID Systems (IC Tags, Reader/Writer, Antenna, etc.)
• Remote Supervisory Systems, Vehicle Disturbance Surveillance Devices
• Commercial Game Machines (Photo Sticker Machine)
Operating income
Operating income
margin (%)
2002 2003 2004
41.4
34.2
24.1
16.1
14.6
10.3
(0.9)
1.0
4.3
6.4
10.4
1.2
7.2
3.8
3.8
3.8
4.5
Operating income
Operating income
margin (%)
2002 2003 2004
Operating income
Operating income
margin (%)
2002 2003 2004
Operating income
Operating income
margin (%)
2002 2003 2004
Operating income
Operating income
margin (%)
2002 2003 2004
(FY)
(FY)
(FY)
(FY)
(FY)
(FY)
Operating income
Operating income
margin (%)
2002 2003 2004
7.6
-5
0
5
10
12.9
9.1
1.0
7.1
13.0
11.9
15.5
15.3
7.6
1.7
16.4
14.9
14.2
15.1
5.6
(1.4)
15.9
16.5
*Operating income indicates income including internal income prior to the deduction of amounts such as interseg-
ment transactions and headquarters expenses that are not apportionable.