Omron 2005 Annual Report Download - page 6
Download and view the complete annual report
Please find page 6 of the 2005 Omron annual report below. You can navigate through the pages in the report by either clicking on the pages listed below, or by using the keyword search tool below to find specific information within the annual report.-
 1
1 -
 2
2 -
 3
3 -
 4
4 -
 5
5 -
 6
6 -
 7
7 -
 8
8 -
 9
9 -
 10
10 -
 11
11 -
 12
12 -
 13
13 -
 14
14 -
 15
15 -
 16
16 -
 17
17 -
18
-
19
-
20
-
21
-
22
-
23
-
24
-
25
-
26
-
27
-
28
-
29
-
30
-
31
-
32
-
33
-
34
-
35
-
36
-
37
-
38
-
39
-
40
-
41
-
42
-
43
-
44
-
45
-
46
-
47
-
48
-
49
-
50
-
51
-
52
-
53
-
54
-
55
-
56
-
57
-
58
-
59
-
60
-
61
-
62
-
63
-
64
-
65
-
66
-
67
-
68
-
69
-
70
-
71
-
72
-
73
-
74
-
75
-
76
-
77
-
78
-
79
-
80
 |
 |

4
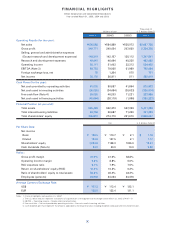
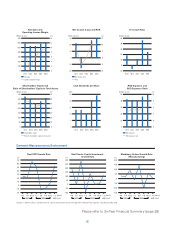
FINANCIAL HIGHLIGHTS
Omron Corporation and Consolidated Subsidiaries
Years ended March 31, 2005, 2004 and 2003
Thousands of
Millions of yen U.S. dollars (Note 2)
2005/3 2004/3 2003/3 2005/3
Operating Results (for the year):
Net sales ¥608,588 ¥584,889 ¥535,073 $5,687,738
Gross profit 249,771 240,054 207,660 2,334,308
Selling, general and administrative expenses
(Except research and development expenses) 144,219 142,157 135,112 1,347,841
Research and development expenses 49,441 46,494 40,235 462,065
Operating income 56,111 51,403 32,313 524,402
EBITDA (Note 3) 84,753 79,065 61,989 792,084
Foreign exchange loss, net 75 1,254 575 701
Net income 30,176 26,811 511 282,019
Cash Flows (for the year):
Net cash provided by operating activities 61,076 80,687 41,854 570,803
Net cash used in investing activities (36,050) (34,484) (30,633) (336,914)
Free cash flow (Note 4) 25,026 46,203 11,221 233,889
Net cash used in financing activities (40,684) (28,119) (1,996) (380,223)
Financial Position (at year-end):
Total assets 585,429 592,273 567,399 5,471,299
Total interest-bearing liabilities 24,759 56,687 71,260 231,393
Total shareholders’ equity 305,810 274,710 251,610 2,858,037
Yen U.S. dollars (Note 2)
Per Share Data:
Net income
Basic ¥ 126.5 ¥ 110.7 ¥ 2.1 $ 1.18
Diluted 124.8 107.5 2.1 1.17
Shareholders’ equity 1,284.8 1148.3 1036.0 12.01
Cash dividends (Note 5) 24.0 20.0 10.0 0.22
Ratios:
Gross profit margin 41.0% 41.0% 38.8%
Operating income margin 9.2% 8.8% 6.0%
R&D expenses ratio 8.1% 7.9% 7.5%
Return on shareholders’ equity (ROE) 10.4% 10.2% 0.2%
Ratio of shareholders’ equity to total assets 52.2% 46.4% 44.3%
Employees (persons) 24,904 24,324 23,476
Average Currency Exchange Rate:
US$ ¥ 107.3 ¥ 113.4 ¥ 122.1
EUR 135.0 132.4 121.1
Notes: 1. Financial Highlights are based on U.S. GAAP.
2. The U.S. dollar amounts represent translations of Japanese yen at the approximate exchange rate on March 31, 2005, of ¥107=$1.
3. EBITDA = Operating income + Depreciation and amortization.
4. Free cash flow = Net cash provided by operating activities – Net cash used in investing activities.
5. Cash dividends per share represent the amounts applicable to the respective year, including dividends to be paid after the end of the year.