Olympus 2013 Annual Report Download - page 16
Download and view the complete annual report
Please find page 16 of the 2013 Olympus annual report below. You can navigate through the pages in the report by either clicking on the pages listed below, or by using the keyword search tool below to find specific information within the annual report.-
 1
1 -
2
-
3
-
4
-
5
-
 6
6 -
 7
7 -
 8
8 -
 9
9 -
 10
10 -
 11
11 -
 12
12 -
 13
13 -
 14
14 -
 15
15 -
 16
16 -
 17
17 -
 18
18 -
 19
19 -
 20
20 -
 21
21 -
 22
22 -
 23
23 -
 24
24 -
 25
25 -
 26
26 -
27
-
28
-
29
-
30
-
31
-
32
-
33
-
34
-
35
-
36
-
37
-
38
-
39
-
40
-
41
-
42
-
43
-
44
-
45
-
46
-
47
-
48
-
49
-
50
-
51
-
52
-
53
-
54
-
55
-
56
-
57
-
58
-
59
 |
 |

28 OLYMPUS Annual Report 2013 29OLYMPUS Annual Report 2013
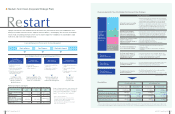
At a Glance
0
200
100
400
300
500
(¥ Billion)
2011/3 2012/3 2013/3 2014/3
(Forecast)
195.5
159.9
191.8
157.4
218.7
176.1
255.7
214.3
355.3 349.2 394.7
470.0
(¥ Billion)
0
40
80
120
44.5
56.3
42.7
49.8
38.9
46.6
45.8
54.2
2011/3 2012/3 2013/3 2014/3
(Forecast)
100.8 92.4 85.5
100.0
(¥ Billion)
0
50
100
150
116.9
14.6
115.2
13.3
95.1
12.5
90.3
13.7
2011/3 2012/3 2013/3 2014/3
(Forecast)
131.4 128.6
107.6 104.0
(¥ Billion)
0
20
40
60
50.0 48.9
41.7
26.0
2011/3 2012/3 2013/3 2014/3
(Forecast)
0
50
100
150
0
5
10
15
20
25
71.7 68.2
87.1
20.2 19.5
22.1
101.0
21.5
(¥ Billion)
2011/3 2012/3 2013/3 2014/3
(Forecast)
(%)
(¥ Billion) (%)
0
10
5
15
0
4
2
6
8
10
8.6
5.4
3.5
8.5
5.9
4.1 7.0
7. 0
2011/3 2012/3 2013/3 2014/3
(Forecast)
(¥ Billion)
–25
0
–10
–15
–20
–5
5
15
10
(15.0)
(10.8)
(23.1)
0
2011/3 2012/3 2013/3 2014/3
(Forecast)
(3.6)
(8.0)
(4.9) (5.0)
–10
–5
0
5
(¥ Billion)
2011/3 2012/3 2013/3 2014/3
(Forecast)
Olympus commands the world’s highest
market share in its gastrointestinal
endoscope operations and is playing an
important role in realizing early diagnoses.
Currently, the Company is focusing on
accelerating growth in the surgical and
endotherapy device fi eld, which is central
to developing minimally invasive
treatments, and in rapidly expanding
emerging markets.
Business DescriptionBusiness Segment Net SalesResults of Operations (FY2013) Operating Income (Loss) / Margin Share of Net Sales
Share of Net Sales by Region
The Company’s life science operations support
the advanced life science fi eld. Olympus is
a global market share leader for biological
microscopes in this fi eld. Key products
provided in our industrial operations include
industrial microscopes as well as industrial
endoscopes and ultrasonic fl aw detectors
that help ensure the safety and security of
social infrastructure through applications in
the non-destructive testing fi eld.
Olympus boasts the leading domestic
share for mirrorless cameras, a fi eld in
which it offers the PEN and OM-D series
of cameras designed with a focus on
being small and light weight and having high
image quality and operability. The Company
also provides unique digital cameras, such
as its high-end, high-power zoom compact
cameras, as well as voice recorders that
command a high market share.
The segment is developing business in
the medical and healthcare fi elds, such as
bone replacement material, and new
businesses operated by Olympus
Business Creation Corp.
On September 28, 2012, the Company transferred its Information & Communication
Business to Japan Industrial Partners, Inc. As a result, performance for fi scal 2013 only
includes the six months ended September 30, 2012. Accordingly, net sales were down
50% year on year, to ¥114.2 billion, and operating income was ¥1.7 billion.
New products introduced into Japan and
overseas in the gastrointestinal endoscope
and surgical and endotherapy device fi elds
made strong contributions to earnings. As a
result, net sales increased 13% year on year,
operating income was up 28%, and the
operating margin improved 2.0 percentage
points, to 22%. With these strong results,
the Medical Business supported the
performance of the entire Company. Endoscopes Surgical & Endotherapy
Life Science Industrial
Digital Cameras Others Operating loss
Operating loss
Operating income Operating margin (right)
Operating income Operating margin (right)
53.1%
Others
2.7%
Asia and
Oceania
13.8%
11.5%
14.5%
15.3%
Both net sales and operating income
were down year on year due to the
impacts of limited capital expenditure by
companies and delayed government
budgets. Regardless, we introduced new
products in both the life science and
industrial fi elds, rationalized production
sites, and otherwise advanced
preparations for growth in fi scal 2014
and onward.
The market for low-priced compact
cameras shrunk rapidly, resulting in a 16%
year-on-year decrease in net sales and the
recording of an operating loss of ¥23.1
billion. Conversely, we saw a 15% increase
in sales of mirrorless cameras, an area of
focus for the Company, with sales growth
particularly prominent in Japan.
Non-core business domains were
reorganized, entailing the sale and
liquidation of unprofi table businesses.
This resulted in a year-on-year decrease
in net sales, but the operating loss
contracted nonetheless.
Medical Business
Company History
Life Science &
Industrial Business
Imaging Business
Others
Information &
Communication
Business
P. 3 0
P. 3 8
P. 4 2
Europe
21.1%
North
America
23.8%
Japan
38.6%
1919
Established as
Takachiho Seisakusho
to manufacture
microscopes in Japan
1936
Semi-Olympus I, the fi rst
Olympus camera intro-
duced, marking entry
into camera business
1920
Asahi 600x microscope
introduced
1975
Entry into medical
surgical endoscopy field
1949
Name changed
to Olympus Optical
Co., Ltd.
The Company listed on
the TSE
1996
Entry into digital camera
business
1950
Development of the
world’s fi rst practical
gastrocamera
1968
Entry into industrial
endoscope field
2008
Acquisition of Gyrus
Group PLC to strengthen
surgical area of Medical
Business
2009
Olympus launches its
fi rst mirrorless inter-
changeable lens camera,
OLYMPUS PEN E-P1
1969
The world’s fi rst micro-
cassette tape recorder
developed
5.6%