Office Depot 2008 Annual Report Download - page 78
Download and view the complete annual report
Please find page 78 of the 2008 Office Depot annual report below. You can navigate through the pages in the report by either clicking on the pages listed below, or by using the keyword search tool below to find specific information within the annual report.-
 1
1 -
2
-
3
-
4
-
5
-
6
-
7
-
8
-
9
-
10
-
11
-
12
-
13
-
14
-
15
-
16
-
17
-
18
-
19
-
20
-
21
-
22
-
23
-
24
-
25
-
26
-
27
-
28
-
29
-
30
-
31
-
32
-
33
-
34
-
35
-
36
-
37
-
38
-
39
-
40
-
41
-
42
-
43
-
44
-
45
-
46
-
47
-
48
-
49
-
50
-
51
-
52
-
53
-
54
-
55
-
56
-
57
-
58
-
59
-
60
-
61
-
62
-
63
-
64
-
65
-
66
-
67
-
 68
68 -
 69
69 -
 70
70 -
 71
71 -
 72
72 -
 73
73 -
 74
74 -
 75
75 -
 76
76 -
 77
77 -
 78
78 -
 79
79 -
 80
80 -
 81
81 -
 82
82 -
 83
83 -
 84
84 -
 85
85 -
 86
86 -
 87
87 -
 88
88 -
89
-
90
 |
 |

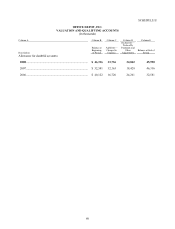
77
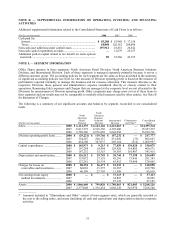
The following tables provide summarized unaudited information from the balance sheet and statement of earnings
for Office Depot de Mexico:
(Dollars in thousands) 2008 2007 2006
Statement of earnings:
Sales ......................................................................................... $ 952,566 $ 850,824 $ 715,679
Gross profit............................................................................... 278,764 245,295 202,274
Net income ............................................................................... 74,226 69,651 54,250
(Dollars in thousands) December 31, 2008 December 31, 2007
Balance Sheet:
Current assets ......................................................................... $ 207,661 $ 202,188
Non-current assets .................................................................. 241,726 250,561
Current liabilities.................................................................... 155,017 169,592
Non-current liabilities............................................................. — —
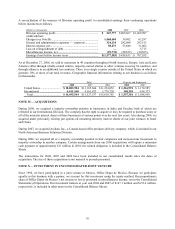
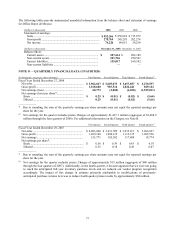
NOTE O — QUARTERLY FINANCIAL DATA (UNAUDITED)
(In thousands, except per share amounts) First Quarter Second Quarter Third Quarter Fourth Quarter(1)
Fiscal Year Ended December 27, 2008
Net sales..................................................................... $ 3,962,017 $ 3,605,073 $ 3,657,857 $ 3,270,597
Gross profit................................................................ 1,168,680 983,516 1,024,441 829,122
Net earnings (loss) ..................................................... 68,773 (2,002) (6,698) (1,539,011)
Net earnings (loss) per share*:...................................
Basic ....................................................................... $ 0.25 $ (0.01) $ (0.02) $ (5.64)
Diluted .................................................................... 0.25 (0.01) (0.02) (5.64)
____________
* Due to rounding, the sum of the quarterly earnings per share amounts may not equal the reported earnings per
share for the year.
(1) Net earnings for the quarter includes pretax Charges of approximately $1,437.1 million (aggregate of $1,468.9
million through the four quarters of 2008). For additional information on the Charges, see Note B.
First Quarter Second Quarter Third Quarter Fourth Quarter(1)
Fiscal Year Ended December 29, 2007
Net sales.................................................................... $ 4,093,600 $ 3,631,599 $ 3,935,411 $ 3,866,927
Gross profit............................................................... 1,269,108 1,096,119 1,115,135 1,022,536
Net earnings.............................................................. 153,771 105,582 117,488 18,774
Net earnings per share*:
Basic ....................................................................... $ 0.56 $ 0.39 $ 0.43 $ 0.07
Diluted .................................................................... 0.55 0.38 0.43 0.07
____________
* Due to rounding, the sum of the quarterly earnings per share amounts may not equal the reported earnings per
share for the year.
(1) Net earnings for the quarter includes pretax Charges of approximately $15 million (aggregate of $40 million
through the four quarters of 2007). Additionally, in the fourth quarter, it became apparent that we were not going
to reach the anticipated full year inventory purchase levels and we reduced our vendor program recognition
accordingly. The impact of this change in estimate primarily attributable to modifications of previously-
anticipated purchase volume tiers was to reduce fourth quarter pretax results by approximately $30 million.