Office Depot 2008 Annual Report Download - page 76
Download and view the complete annual report
Please find page 76 of the 2008 Office Depot annual report below. You can navigate through the pages in the report by either clicking on the pages listed below, or by using the keyword search tool below to find specific information within the annual report.-
 1
1 -
2
-
3
-
4
-
5
-
6
-
7
-
8
-
9
-
10
-
11
-
12
-
13
-
14
-
15
-
16
-
17
-
18
-
19
-
20
-
21
-
22
-
23
-
24
-
25
-
26
-
27
-
28
-
29
-
30
-
31
-
32
-
33
-
34
-
35
-
36
-
37
-
38
-
39
-
40
-
41
-
42
-
43
-
44
-
45
-
46
-
47
-
48
-
49
-
50
-
51
-
52
-
53
-
54
-
55
-
56
-
57
-
58
-
59
-
60
-
61
-
62
-
63
-
64
-
65
-
 66
66 -
 67
67 -
 68
68 -
 69
69 -
 70
70 -
 71
71 -
 72
72 -
 73
73 -
 74
74 -
 75
75 -
 76
76 -
 77
77 -
 78
78 -
 79
79 -
 80
80 -
 81
81 -
 82
82 -
 83
83 -
 84
84 -
 85
85 -
 86
86 -
87
-
88
-
89
-
90
 |
 |

75
NOTE K — SUPPLEMENTAL INFORMATION ON OPERATING, INVESTING AND FINANCING
ACTIVITIES
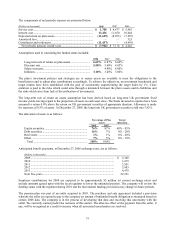
Additional supplemental information related to the Consolidated Statements of Cash Flows is as follows:
(Dollars in thousands) 2008 2007 2006
Cash paid for:
Interest ....................................................................................... $ 55,208 $ 53,948 $ 37,158
Taxes.......................................................................................... 18,848 126,182 208,606
Non-cash asset additions under capital leases ............................... 197,912 18,435 26,542
Non-cash capital expenditure accruals .......................................... — 13,679 25,157
Additional paid-in capital related to tax benefit on stock options
exercised...................................................................................... 89 18,266 43,355
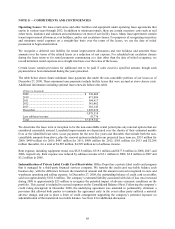
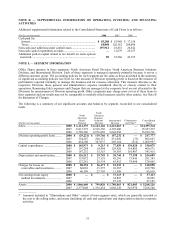
NOTE L — SEGMENT INFORMATION
Office Depot operates in three segments: North American Retail Division, North American Business Solutions
Division, and International Division. Each of these segments is managed separately primarily because it serves a
different customer group. The accounting policies for each segment are the same as those described in the summary
of significant accounting policies (see Note A). Our measure of Division operating profit is based on the measure of
performance reported internally to manage the business and for resource allocation. This measure allocates to the
respective Divisions those general and administrative expense considered directly or closely related to their
operations. Remaining G&A expenses and Charges that are managed at the corporate level are not allocated to the
Divisions for measurement of Division operating profit. Other companies may charge more or less of these items to
their segments and our results may not be comparable to similarly titled measures used by other entities. See Note B
for discussion of Charges.
The following is a summary of our significant accounts and balances by segment, reconciled to our consolidated
totals.
(Dollars in thousands)
North
American
Retail
Division
North
American
Business
Solutions
Division
International
Division
Eliminations
and Other*
Consolidated
Total
Sales.................................................. 2008 $ 6,112,335 $ 4,142,146 $ 4,241,063 $ — $14,495,544
2007 6,813,575 4,518,356 4,195,606 — 15,527,537
2006 6,789,386 4,576,803 3,644,592 — 15,010,781
Division operating profit (loss)......... 2008 $ (29,221) $ 119,766 $ 157,232 $ — $ 247,777
2007 354,547 220,137 231,056 (73) 805,667
2006 454,308 367,037 249,164 (512) 1,069,997
Capital expenditures ......................... 2008 $ 103,973 $ 9,215 $ 77,859 $ 139,028 $ 330,075
2007 197,284 18,494 129,928 114,865 460,571
2006 187,232 15,353 39,363 101,467 343,415
Depreciation and amortization.......... 2008 $ 126,212 $ 19,745 $ 30,744 $ 77,398 $ 254,099
2007 133,012 27,135 45,291 75,945 281,383
2006 127,261 29,334 43,912 78,498 279,005
Charges for losses on 2008 $ 80,354 $ 36,471 $ 23,233 $ — $ 140,058
receivables and inventories........... 2007 66,036 33,375 10,387 — 109,798
2006 46,399 27,703 11,508 — 85,610
Net earnings from equity 2008 $ — $ — $ 37,113 $ — $ 37,113
method investments....................... 2007 — — 34,825 — 34,825
2006 — — 27,125 — 27,125
Assets................................................ 2008 $ 1,866,460 $ 799,820 $ 1,780,863 $ 821,083 $ 5,268,226
2007 2,377,008 1,335,434 3,002,128 541,970 7,256,540
____________
* Amounts included in “Eliminations and Other” consist of inter-segment sales, which are generally recorded at
the cost to the selling entity, and assets (including all cash and equivalents) and depreciation related to corporate
activities.