Office Depot 2008 Annual Report Download - page 54
Download and view the complete annual report
Please find page 54 of the 2008 Office Depot annual report below. You can navigate through the pages in the report by either clicking on the pages listed below, or by using the keyword search tool below to find specific information within the annual report.-
 1
1 -
2
-
3
-
4
-
5
-
6
-
7
-
8
-
9
-
10
-
11
-
12
-
13
-
14
-
15
-
16
-
17
-
18
-
19
-
20
-
21
-
22
-
23
-
24
-
25
-
26
-
27
-
28
-
29
-
30
-
31
-
32
-
33
-
34
-
35
-
36
-
37
-
38
-
39
-
40
-
41
-
42
-
43
-
 44
44 -
 45
45 -
 46
46 -
 47
47 -
 48
48 -
 49
49 -
 50
50 -
 51
51 -
 52
52 -
 53
53 -
 54
54 -
 55
55 -
 56
56 -
 57
57 -
 58
58 -
 59
59 -
 60
60 -
 61
61 -
 62
62 -
 63
63 -
 64
64 -
65
-
66
-
67
-
68
-
69
-
70
-
71
-
72
-
73
-
74
-
75
-
76
-
77
-
78
-
79
-
80
-
81
-
82
-
83
-
84
-
85
-
86
-
87
-
88
-
89
-
90
 |
 |

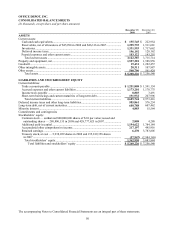
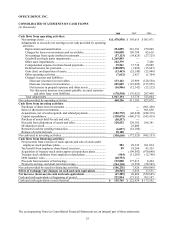
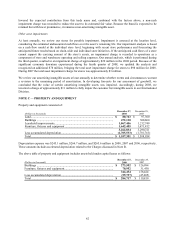
OFFICE DEPOT, INC.
The accompanying Notes to Consolidated Financial Statements are an integral part of these statements.
53
CONSOLIDATED STATEMENTS OF CASH FLOWS
(In thousands)
2008 2007 2006
Cash flows from operating activities:
Net earnings (loss) ................................................................................... $ (1,478,938) $ 395,615 $ 503,471
Adjustments to reconcile net earnings to net cash provided by operating
activities:
Depreciation and amortization............................................................ 254,099 281,383 279,005
Charges for losses on inventories and receivables.............................. 140,058 109,798 85,610
Net earnings from equity method investments ................................... (37,113) (34,825) (27,125)
Goodwill and trade name impairments............................................... 1,269,893 — —
Other asset impairments ..................................................................... 222,379 — 7,450
Compensation expense for share-based payments.............................. 39,561 37,738 39,889
Deferred income tax provision ........................................................... (108,099) (1,022) (15,847)
Gain (loss) on disposition of assets..................................................... (13,443) (25,190) (23,948)
Other operating activities.................................................................... (7,612) 2,927 (1,704)
Changes in assets and liabilities:
Decrease (increase) in receivables ................................................ 133,162 25,909 (128,558)
Decrease (increase) in inventories ................................................ 249,849 (191,685) (155,955)
Net increase in prepaid expenses and other assets........................ (16,986) (12,342) (23,212)
Net (decrease) increase in accounts payable, accrued expenses
and other long- term liabilities................................................ (178,554) (176,921) 287,999
Total adjustments................................................................................ 1,947,194 15,770 323,604
Net cash provided by operating activities.................................................... 468,256 411,385 827,075
Cash flows from investing activities:
Purchases of short-term investments ....................................................... — — (961,450)
Sales of short-term investments............................................................... — — 961,650
Acquisitions, net of cash acquired, and related payments........................ (102,752) (48,036) (248,319)
Capital expenditures ................................................................................ (330,075) (460,571) (343,415)
Purchase of assets held for sale and sold ................................................. (38,537) — —
Proceeds from disposition of assets and other ......................................... 120,632 129,182 106,381
Dividends received .................................................................................. — 25,000 —
Restricted cash for pending transaction ................................................... (6,037) (18,100) —
Release of restricted cash......................................................................... 18,100 — —
Net cash used in investing activities............................................................ (338,669) (372,525) (485,153)
Cash flows from financing activities:
Net proceeds from exercise of stock options and sale of stock under
employee stock purchase plans.............................................................. 503 29,332 101,034
Tax benefit from employee share-based exercises................................... 89 18,266 43,355
Acquisition of treasury stock under approved repurchase plans .............. — (199,592) (970,640)
Treasury stock additions from employee related plans ............................ (944) (11,201) (12,796)
Debt issuance costs.................................................................................. (40,793) — —
Proceeds from issuance of borrowings .................................................... 139,098 177,413 8,494
Payments on long- and short-term borrowings........................................ (284,204) (6,292) (58,545)
Net cash provided by (used in) financing activities..................................... (186,251) 7,926 (889,098)
Effect of exchange rate changes on cash and cash equivalents.............. (10,545) 2,616 17,531
Net increase (decrease) in cash and cash equivalents ............................. (67,209) 49,402 (529,645)
Cash and cash equivalents at beginning of period....................................... 222,954 173,552 703,197
Cash and cash equivalents at end of period ................................................. $ 155,745 $ 222,954 $ 173,552