NVIDIA 2010 Annual Report Download - page 66
Download and view the complete annual report
Please find page 66 of the 2010 NVIDIA annual report below. You can navigate through the pages in the report by either clicking on the pages listed below, or by using the keyword search tool below to find specific information within the annual report.-
 1
1 -
2
-
3
-
4
-
5
-
6
-
7
-
8
-
9
-
10
-
11
-
12
-
13
-
14
-
15
-
16
-
17
-
18
-
19
-
20
-
21
-
22
-
23
-
24
-
25
-
26
-
27
-
28
-
29
-
30
-
31
-
32
-
33
-
34
-
35
-
36
-
37
-
38
-
39
-
40
-
41
-
42
-
43
-
44
-
45
-
46
-
47
-
48
-
49
-
50
-
51
-
52
-
53
-
54
-
55
-
 56
56 -
 57
57 -
 58
58 -
 59
59 -
 60
60 -
 61
61 -
 62
62 -
 63
63 -
 64
64 -
 65
65 -
 66
66 -
 67
67 -
 68
68 -
 69
69 -
 70
70 -
 71
71 -
 72
72 -
 73
73 -
 74
74 -
 75
75 -
 76
76 -
77
-
78
-
79
-
80
-
81
-
82
-
83
-
84
-
85
-
86
-
87
-
88
-
89
-
90
-
91
-
92
-
93
-
94
-
95
-
96
-
97
-
98
-
99
-
100
-
101
-
102
-
103
-
104
-
105
-
106
-
107
-
108
-
109
-
110
-
111
-
112
-
113
-
114
-
115
-
116
-
117
-
118
-
119
-
120
-
121
-
122
-
123
-
124
-
125
-
126
-
127
-
128
-
129
-
130
-
131
-
132
-
133
-
134
-
135
-
136
-
137
-
138
-
139
-
140
-
141
-
142
-
143
-
144
-
145
-
146
-
147
-
148
-
149
-
150
-
151
-
152
-
153
-
154
-
155
-
156
-
157
-
158
-
159
-
160
-
161
-
162
-
163
-
164
-
165
-
166
-
167
-
168
-
169
-
170
-
171
-
172
-
173
-
174
-
175
-
176
 |
 |

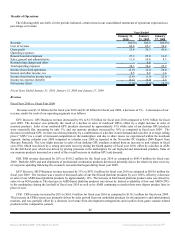
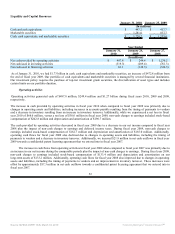
Liquidity and Capital Resources
January 31, 2010 January 25, 2009
(In millions)
Cash and cash equivalents $ 447.2 $ 417.7
Marketable securities 1,281.0 837.7
Cash, cash equivalents, and marketable securities $ 1,728.2 $ 1,255.4
Year Ended
January 31, January 25, January 27,
2010 2009 2008
(In millions)
Net cash provided by operating activities $ 487.8 $ 249.4 $ 1,270.2
Net cash used in investing activities (519.3) (209.4) (761.3)
Net cash used in financing activities 61.1 (349.3) (326.3)
As of January 31, 2010, we had $1.73 billion in cash, cash equivalents and marketable securities, an increase of $472.8 million from
the end of fiscal year 2009. Our portfolio of cash equivalents and marketable securities is managed by several financial institutions.
Our investment policy requires the purchase of top-tier investment grade securities, the diversification of asset types and includes
certain limits on our portfolio duration.
Operating activities
Operating activities generated cash of $487.8 million, $249.4 million and $1.27 billion during fiscal years 2010, 2009 and 2008,
respectively.
The increase in cash provided by operating activities in fiscal year 2010 when compared to fiscal year 2009 was primarily due to
changes in operating assets and liabilities, including increases in accounts payable resulting from the timing of payments to vendors
and a decrease in inventory resulting from an increase in inventory turnover. Additionally, while we experienced a net loss in fiscal
year 2010 of $68.0 million, versus a net loss of $30.0 million in fiscal year 2009, non-cash charges to earnings included stock-based
compensation of $242.8 million and depreciation and amortization of $196.7 million.
The cash provided by operating activities decreased in fiscal year 2009 due to a decrease in our net income compared to fiscal year
2008 plus the impact of non-cash charges to earnings and deferred income taxes. During fiscal year 2009, non-cash charges to
earnings included stock-based compensation of $162.7 million and depreciation and amortization of $185.0 million. Additionally,
operating cash flows for fiscal year 2009 also declined due to changes in operating assets and liabilities, including the timing of
payments to vendors and a decrease in inventory turnover. Additionally, we incurred $21.8 million in net cash outflows in fiscal year
2009 towards a confidential patent licensing agreement that we entered into in fiscal year 2007.
The increase in cash flows from operating activities in fiscal year 2008 when compared to fiscal year 2007 was primarily due to
an increase in our net income during the comparable periods plus the impact of non-cash charges to earnings. During fiscal year 2008,
non-cash charges to earnings included stock-based compensation of $133.4 million and depreciation and amortization on our
long-term assets of $133.2 million. Additionally, operating cash flows for fiscal year 2008 also improved due to changes in operating
assets and liabilities, including the timing of payments to vendors and an improvement in inventory turnover. These increases were
offset by approximately $57.3 million in net cash outflows towards a confidential patent licensing agreement that we entered into in
fiscal year 2007.
52
Source: NVIDIA CORP, 10-K, March 18, 2010 Powered by Morningstar® Document Research℠