NVIDIA 2010 Annual Report Download - page 65
Download and view the complete annual report
Please find page 65 of the 2010 NVIDIA annual report below. You can navigate through the pages in the report by either clicking on the pages listed below, or by using the keyword search tool below to find specific information within the annual report.-
 1
1 -
2
-
3
-
4
-
5
-
6
-
7
-
8
-
9
-
10
-
11
-
12
-
13
-
14
-
15
-
16
-
17
-
18
-
19
-
20
-
21
-
22
-
23
-
24
-
25
-
26
-
27
-
28
-
29
-
30
-
31
-
32
-
33
-
34
-
35
-
36
-
37
-
38
-
39
-
40
-
41
-
42
-
43
-
44
-
45
-
46
-
47
-
48
-
49
-
50
-
51
-
52
-
53
-
54
-
 55
55 -
 56
56 -
 57
57 -
 58
58 -
 59
59 -
 60
60 -
 61
61 -
 62
62 -
 63
63 -
 64
64 -
 65
65 -
 66
66 -
 67
67 -
 68
68 -
 69
69 -
 70
70 -
 71
71 -
 72
72 -
 73
73 -
 74
74 -
 75
75 -
76
-
77
-
78
-
79
-
80
-
81
-
82
-
83
-
84
-
85
-
86
-
87
-
88
-
89
-
90
-
91
-
92
-
93
-
94
-
95
-
96
-
97
-
98
-
99
-
100
-
101
-
102
-
103
-
104
-
105
-
106
-
107
-
108
-
109
-
110
-
111
-
112
-
113
-
114
-
115
-
116
-
117
-
118
-
119
-
120
-
121
-
122
-
123
-
124
-
125
-
126
-
127
-
128
-
129
-
130
-
131
-
132
-
133
-
134
-
135
-
136
-
137
-
138
-
139
-
140
-
141
-
142
-
143
-
144
-
145
-
146
-
147
-
148
-
149
-
150
-
151
-
152
-
153
-
154
-
155
-
156
-
157
-
158
-
159
-
160
-
161
-
162
-
163
-
164
-
165
-
166
-
167
-
168
-
169
-
170
-
171
-
172
-
173
-
174
-
175
-
176
 |
 |

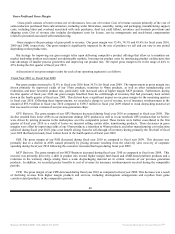
Restructuring Charges and Other
We announced a workforce reduction to allow for continued investment in strategic growth areas during fiscal year 2009. As a
result, we eliminated approximately 360 positions worldwide, or about 6.5% of our global workforce. During fiscal year 2009,
expenses associated with the workforce reduction, which were comprised primarily of severance and benefits payments to these
employees, totaled $8.0 million.
Restructuring and other expenses in fiscal year 2009 also included a non-recurring charge of $18.9 million associated with the
termination of a development contract related to a new campus construction project that has been put on hold. There were no
restructuring related charges in fiscal years 2010 or 2008.
Interest Income and Interest Expense
Interest income, net of interest expense consists of interest earned on cash, cash equivalents and marketable securities. Interest
income decreased to $19.8 million in fiscal year 2010, from $42.5 million in fiscal year 2009 primarily due to the result of lower
interest rates and interest expense recorded on a capital lease for a data center in Santa Clara, California during fiscal year
2010. Interest income decreased to $42.5 million in fiscal year 2009 from $64.2 million in fiscal year 2008 primarily due to the result
of lower average balances of cash, cash equivalents and marketable securities and lower interest rates in fiscal year 2009 compared to
fiscal year 2008.
Other Income (Expense), net
Other income and expense primarily consists of realized gains and losses on the sale of marketable securities and foreign
currency translation. Other (expense), net of other income was ($3.1) million, ($14.7) million, and $0.8 million in fiscal years 2010,
2009, and 2008, respectively. The fluctuation between these years was primarily due to other than temporary impairment charges of
$9.9 million that we recorded during fiscal year 2009. These charges included $5.6 million related to an other than temporary
impairment of our investment in the money market funds held by the Reserve International Liquidity Fund, Ltd., or International
Reserve Fund, $2.5 million related to a decline in the value of publicly traded equity securities and $1.8 million related to debt
securities held by us that were issued by companies that had filed for bankruptcy. Please refer to Note 18 of the Notes to the
Consolidated Financial Statements in Part IV, Item 15 of this Form 10-K for further discussion.
Income Taxes
We recognized income tax expense (benefit) of $(14.3) million, $(12.9) million and $103.7 million during fiscal years 2010, 2009
and 2008, respectively. Income tax expense (benefit) as a percentage of income (loss) before taxes, or our annual effective tax rate,
was 17.4 % in fiscal year 2010, 30.0% in fiscal year 2009 and 11.5% in fiscal year 2008.
The difference in the effective tax rates amongst the three years was primarily a result of changes in our geographic mix of
income subject to tax, with the additional impact of the federal research tax credit recognized in fiscal years 2010 and 2009 relative to
the loss before taxes in such fiscal years.
Please refer to Note 14 of the Notes to the Consolidated Financial Statements in Part IV, Item 15 of this Form 10-K for further
information regarding the components of our income tax expense.
51
Source: NVIDIA CORP, 10-K, March 18, 2010 Powered by Morningstar® Document Research℠