NVIDIA 2010 Annual Report Download - page 55
Download and view the complete annual report
Please find page 55 of the 2010 NVIDIA annual report below. You can navigate through the pages in the report by either clicking on the pages listed below, or by using the keyword search tool below to find specific information within the annual report.-
 1
1 -
2
-
3
-
4
-
5
-
6
-
7
-
8
-
9
-
10
-
11
-
12
-
13
-
14
-
15
-
16
-
17
-
18
-
19
-
20
-
21
-
22
-
23
-
24
-
25
-
26
-
27
-
28
-
29
-
30
-
31
-
32
-
33
-
34
-
35
-
36
-
37
-
38
-
39
-
40
-
41
-
42
-
43
-
44
-
 45
45 -
 46
46 -
 47
47 -
 48
48 -
 49
49 -
 50
50 -
 51
51 -
 52
52 -
 53
53 -
 54
54 -
 55
55 -
 56
56 -
 57
57 -
 58
58 -
 59
59 -
 60
60 -
 61
61 -
 62
62 -
 63
63 -
 64
64 -
 65
65 -
66
-
67
-
68
-
69
-
70
-
71
-
72
-
73
-
74
-
75
-
76
-
77
-
78
-
79
-
80
-
81
-
82
-
83
-
84
-
85
-
86
-
87
-
88
-
89
-
90
-
91
-
92
-
93
-
94
-
95
-
96
-
97
-
98
-
99
-
100
-
101
-
102
-
103
-
104
-
105
-
106
-
107
-
108
-
109
-
110
-
111
-
112
-
113
-
114
-
115
-
116
-
117
-
118
-
119
-
120
-
121
-
122
-
123
-
124
-
125
-
126
-
127
-
128
-
129
-
130
-
131
-
132
-
133
-
134
-
135
-
136
-
137
-
138
-
139
-
140
-
141
-
142
-
143
-
144
-
145
-
146
-
147
-
148
-
149
-
150
-
151
-
152
-
153
-
154
-
155
-
156
-
157
-
158
-
159
-
160
-
161
-
162
-
163
-
164
-
165
-
166
-
167
-
168
-
169
-
170
-
171
-
172
-
173
-
174
-
175
-
176
 |
 |

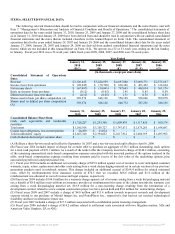
License and Development Revenue
For license arrangements that require significant customization of our intellectual property components, we generally recognize
this license revenue over the period that services are performed. For all license and service arrangements, we determine progress to
completion based on actual direct labor hours incurred to date as a percentage of the estimated total direct labor hours required to
complete the project. We periodically evaluate the actual status of each project to ensure that the estimates to complete each contract
remain accurate. A provision for estimated losses on contracts is made in the period in which the loss becomes probable and can be
reasonably estimated. Costs incurred in advance of revenue recognized are recorded as deferred costs on uncompleted contracts. If the
amount billed exceeds the amount of revenue recognized, the excess amount is recorded as deferred revenue. Revenue recognized in
any period is dependent on our progress toward completion of projects in progress. Significant management judgment and discretion
are used to estimate total direct labor hours. Any changes in or deviations from these estimates could have a material effect on the
amount of revenue we recognize in any period.
Accounts Receivable
We maintain an allowance for doubtful accounts receivable for estimated losses resulting from the inability of our customers to
make required payments. Management determines this allowance, which consists of an amount identified for specific customer issues
as well as an amount based on overall estimated exposure. Our accounts receivable are highly concentrated and make us vulnerable to
adverse changes in our customers' businesses, and to downturns in the industry and the worldwide economy. Our overall estimated
exposure excludes significant amounts that are covered by credit insurance and letters of credit. If the financial condition of our
customers, the financial institutions providing letters of credit, or our credit insurance carrier were to deteriorate, resulting in an
impairment of their ability to make payments, additional allowances may be required that could adversely affect our operating results.
This risk is heightened during periods when economic conditions worsen, such as the when the worldwide economy is experiencing a
significant downturn. The financial turmoil that affected the banking system and financial markets and increased the risk that financial
institutions mighty consolidate or go out of business resulted in a tightening in the credit markets, a lower than normal level of
liquidity in many financial markets, and extreme volatility in fixed income, credit, currency and equity markets. There could be a
number of follow-on effects from this type of credit crisis on our business, including inability of customers, including channel
partners, to obtain credit to finance purchases of our products and/or customer, insolvencies and failure of financial institutions, which
could negatively impact our financial results. Furthermore, there can be no assurance that we will be able to continue to obtain credit
insurance in the future.
As of January 31, 2010, our allowance for doubtful accounts receivable was $1.0 million and our gross accounts receivable
balance was $414.0 million. Of the $414.0 million, $95.9 million was covered by credit insurance and $15.8 million was covered by
letters of credit. If the financial condition of our customers were to deteriorate, resulting in an impairment of their ability to make
payments, additional allowances may be required and we may have to record additional reserves or write-offs on certain sales
transactions in the future. Factors impacting the allowance include the level of gross receivables, the financial condition of our
customers and the extent to which balances are covered by credit insurance or letters of credit. We have incurred cumulative bad debts
of $0.5 million over the last three fiscal years. As a result of our low bad debt experience, our allowance for doubtful accounts
receivable has ranged between 0.1% and 0.3% during fiscal years 2010 and 2009, respectively. As of January 31, 2010, our allowance
for doubtful accounts receivable represented 0.2% of our gross accounts receivable balance.
Inventories
Inventory cost is computed on an adjusted standard basis; which approximates actual cost on an average or first-in, first-out basis.
We write down our inventory for estimated lower of cost or market, obsolescence or unmarketable inventory equal to the difference
between the cost of inventory and the estimated market value based upon assumptions about future demand, future product purchase
commitments, estimated manufacturing yield levels and market conditions. If actual market conditions are less favorable than those
projected by management, or if our future product purchase commitments to our suppliers exceed our forecasted future demand for
such products, additional future inventory write-downs may be required that could adversely affect our operating results. Inventory
reserves once established are not reversed until the related inventory has been sold or scrapped, so if actual market conditions are more
favorable in the fiscal periods subsequent to that in which we record larger than normal inventory reserves, we may have higher gross
margins when products are sold. As of January 31, 2010, our inventory reserve was $64.8 million. As a percentage of our gross
inventory balance, our inventory reserve has ranged between 7.8% and 19.6% during fiscal years 2010 and 2009. As of January 31,
2010, our inventory reserve represented 16.4% of our gross inventory balance.
41
Source: NVIDIA CORP, 10-K, March 18, 2010 Powered by Morningstar® Document Research℠