NVIDIA 2010 Annual Report Download - page 61
Download and view the complete annual report
Please find page 61 of the 2010 NVIDIA annual report below. You can navigate through the pages in the report by either clicking on the pages listed below, or by using the keyword search tool below to find specific information within the annual report.-
 1
1 -
2
-
3
-
4
-
5
-
6
-
7
-
8
-
9
-
10
-
11
-
12
-
13
-
14
-
15
-
16
-
17
-
18
-
19
-
20
-
21
-
22
-
23
-
24
-
25
-
26
-
27
-
28
-
29
-
30
-
31
-
32
-
33
-
34
-
35
-
36
-
37
-
38
-
39
-
40
-
41
-
42
-
43
-
44
-
45
-
46
-
47
-
48
-
49
-
50
-
 51
51 -
 52
52 -
 53
53 -
 54
54 -
 55
55 -
 56
56 -
 57
57 -
 58
58 -
 59
59 -
 60
60 -
 61
61 -
 62
62 -
 63
63 -
 64
64 -
 65
65 -
 66
66 -
 67
67 -
 68
68 -
 69
69 -
 70
70 -
 71
71 -
72
-
73
-
74
-
75
-
76
-
77
-
78
-
79
-
80
-
81
-
82
-
83
-
84
-
85
-
86
-
87
-
88
-
89
-
90
-
91
-
92
-
93
-
94
-
95
-
96
-
97
-
98
-
99
-
100
-
101
-
102
-
103
-
104
-
105
-
106
-
107
-
108
-
109
-
110
-
111
-
112
-
113
-
114
-
115
-
116
-
117
-
118
-
119
-
120
-
121
-
122
-
123
-
124
-
125
-
126
-
127
-
128
-
129
-
130
-
131
-
132
-
133
-
134
-
135
-
136
-
137
-
138
-
139
-
140
-
141
-
142
-
143
-
144
-
145
-
146
-
147
-
148
-
149
-
150
-
151
-
152
-
153
-
154
-
155
-
156
-
157
-
158
-
159
-
160
-
161
-
162
-
163
-
164
-
165
-
166
-
167
-
168
-
169
-
170
-
171
-
172
-
173
-
174
-
175
-
176
 |
 |

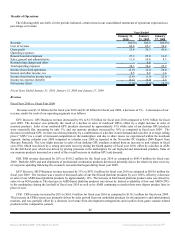
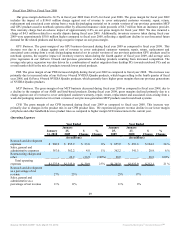
Fiscal Year 2009 vs. Fiscal Year 2008
Revenue was $3.42 billion for fiscal year 2009, compared to $4.10 billion for fiscal year 2008, which represents a decrease of
16%. A discussion of our revenue results for each of our operating segments is as follows:
GPU Business. GPU business revenue decreased by 24% to $1.91 billion for fiscal year 2009, compared to $2.52 billion for
fiscal year 2008. This decrease resulted from decreased sales of our desktop GPU and memory products, offset by increased sales of
our notebook GPU products. Sales of our desktop GPU and memory products decreased by approximately 29% and 59%,
respectively, in fiscal year 2009 when compared to fiscal year 2008. These decreases were primarily due to a decline in the
Standalone Desktop market segment as reported in the December 2008 PC Graphics Report from Mercury Research, driven by a
combination of market migration from desktop PCs towards notebook PCs and an overall market shift in the mix of products towards
lower priced products. This overall market decline translated into a decline of over 20% in the number of units of desktop GPU
products that we sold in fiscal year 2009 compared to fiscal year 2008. The decline in desktop GPU revenue also reflects the impact of
a slight average sales price regression in our products and a decline in our share position during the middle portion of fiscal year 2009
as a result of increased competition. Memory sales declined as a result of a decline in sales of our high-end desktop GPU
products. Sales of our notebook GPU products increased approximately 3% in fiscal year 2009 when compared to fiscal year 2008,
due to higher unit sales aided by a market move toward notebook PCs over desktop PCs, offset by a slight decline in average selling
prices. Additionally, the overall global economic recessionary climate contributed to a significant decline in the demand for total
graphics during the fourth quarter of fiscal year 2009.
PSB. PSB revenue increased by 18% to $693.4 million for fiscal year 2009, compared to $588.4 million for fiscal year 2008. Our
NVIDIA professional workstation product sales increased due to an overall unit increase of approximately 15% in shipments of boards
and chips as compared to fiscal year 2008, due to strong demand and our transition from previous generations of NVIDIA Quadro
professional workstation products to GeForce 8-based and GeForce 9-based products. Sales of NVIDIA Quadro CX for Adobe’s CS4
software, which we launched in the third quarter of fiscal year 2009, also contributed towards the increase in sales in fiscal year 2009.
MCP Business. MCP business revenue decreased by 8% to $655.6 million for fiscal year 2009, compared to $710.4 million for
fiscal year 2008. This decrease was due to a decline of approximately 32% in sales of our AMD-based platform products resulting
from increased competition in AMD-based products, offset by an increase of approximately 120% in sales of our Intel-based platform
products. The increase in Intel-based product sales was driven by sales of our GeForce 9400M mGPU, which we launched in October
2008 along with Apple Inc., or Apple, for their new lineup of Mac notebooks, and our new GeForce 9400 and 9300 mGPUs for Intel
desktop PCs.
CPB. CPB revenue decreased by 46% to $136.3 million for fiscal year 2009, compared to $251.1 million for fiscal year 2008. The
decline in CPB revenue is primarily driven by a combination of a decrease in revenue from our cell phone products and a decrease in
revenue from Sony Computer Entertainment, or SCE. The decrease in revenue from our cell phone products resulted from our shift
from marketing and developing legacy products to achieving design wins and marketing our newer Tegra products. The decrease in
our revenue from SCE resulted from a decline in license revenue and a decline in royalty revenue that was caused by a lower number
of units shipped as well as by a step-down in the per unit royalty rate during the year due to achievement of a unit-based milestone in
our agreement with SCE.
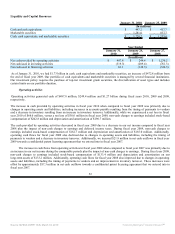
Concentration of Revenue
We generated 84%, 87% and 89% of our total revenue for fiscal years 2010, 2009 and 2008, respectively, from sales to
customers outside the United States and other Americas. Revenue by geographic region is allocated to individual countries based on
the location to which the products are initially billed even if the foreign contract equipment manufacturers, or CEMs’, add-in board
and motherboard manufacturers’ revenue is attributable to end customers in a different location.
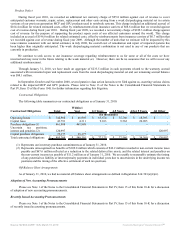
Revenue from significant customers, those representing 10% or more of total revenue for the respective dates, is summarized as
follows:
Year Ended
January 31,
2010
January 25,
2009
January 27,
2008
Revenue:
Customer A 12 % 7 % 5%
Customer B 9 % 8 % 10%
Customer C 7 % 11 % 7%
47
Source: NVIDIA CORP, 10-K, March 18, 2010 Powered by Morningstar® Document Research℠