NVIDIA 2010 Annual Report Download - page 110
Download and view the complete annual report
Please find page 110 of the 2010 NVIDIA annual report below. You can navigate through the pages in the report by either clicking on the pages listed below, or by using the keyword search tool below to find specific information within the annual report.-
 1
1 -
2
-
3
-
4
-
5
-
6
-
7
-
8
-
9
-
10
-
11
-
12
-
13
-
14
-
15
-
16
-
17
-
18
-
19
-
20
-
21
-
22
-
23
-
24
-
25
-
26
-
27
-
28
-
29
-
30
-
31
-
32
-
33
-
34
-
35
-
36
-
37
-
38
-
39
-
40
-
41
-
42
-
43
-
44
-
45
-
46
-
47
-
48
-
49
-
50
-
51
-
52
-
53
-
54
-
55
-
56
-
57
-
58
-
59
-
60
-
61
-
62
-
63
-
64
-
65
-
66
-
67
-
68
-
69
-
70
-
71
-
72
-
73
-
74
-
75
-
76
-
77
-
78
-
79
-
80
-
81
-
82
-
83
-
84
-
85
-
86
-
87
-
88
-
89
-
90
-
91
-
92
-
93
-
94
-
95
-
96
-
97
-
98
-
99
-
 100
100 -
 101
101 -
 102
102 -
 103
103 -
 104
104 -
 105
105 -
 106
106 -
 107
107 -
 108
108 -
 109
109 -
 110
110 -
 111
111 -
 112
112 -
 113
113 -
 114
114 -
 115
115 -
 116
116 -
 117
117 -
 118
118 -
 119
119 -
 120
120 -
121
-
122
-
123
-
124
-
125
-
126
-
127
-
128
-
129
-
130
-
131
-
132
-
133
-
134
-
135
-
136
-
137
-
138
-
139
-
140
-
141
-
142
-
143
-
144
-
145
-
146
-
147
-
148
-
149
-
150
-
151
-
152
-
153
-
154
-
155
-
156
-
157
-
158
-
159
-
160
-
161
-
162
-
163
-
164
-
165
-
166
-
167
-
168
-
169
-
170
-
171
-
172
-
173
-
174
-
175
-
176
 |
 |

NVIDIA CORPORATION AND SUBSIDIARIES
NOTES TO THE CONSOLIDATED FINANCIAL STATEMENTS
(Continued)
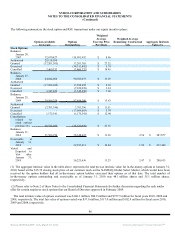
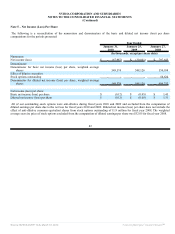
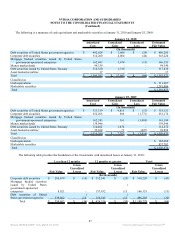
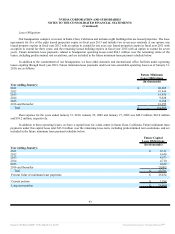
The following is a summary of cash equivalents and marketable securities at January 31, 2010 and January 25, 2009:
January 31, 2010
Amortized
Cost
Unrealized
Gain
Unrealized
Loss
Estimated
Fair Value
(In thousands)
Debt securities of United States government agencies $ 492,628 $ 3,606 $ (29) $ 496,205
Corporate debt securities 514,200 4,064 (44) 518,220
Mortgage backed securities issued by United States
government-sponsored enterprises 162,693 3,674 (13) 166,353
Money market funds 94,339 - - 94,340
Debt securities issued by United States Treasury 316,520 1,318 - 317,838
Asset-backed securities 17 - - 17
Total $ 1,580,397 $ 12,662 $ (86) $ 1,592,973
Classified as:
Cash equivalents $ 311,967
Marketable securities 1,281,006
Total $ 1,592,973
January 25, 2009
Amortized
Cost
Unrealized
Gain
Unrealized
Loss
Estimated
Fair Value
(In thousands)
Debt securities of United States government agencies $ 313,319 $ 4,815 $ (13) $ 318,121
Corporate debt securities 252,265 680 (1,771) 251,174
Mortgage backed securities issued by United States
government-sponsored enterprises 162,243 361 (1,405) 161,199
Money market funds 139,046 - - 139,046
Debt securities issued by United States Treasury 110,402 1,870 - 112,272
Asset-backed securities 39,014 71 (227) 38,858
Total $ 1,016,289 $ 7,797 $ (3,416) $ 1,020,670
Classified as:
Cash equivalents $ 182,968
Marketable securities 837,702
Total $ 1,020,670
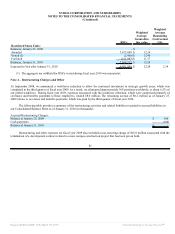
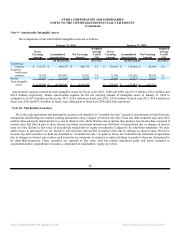
The following table provides the breakdown of the investments with unrealized losses at January 31, 2010:
Less than 12 months 12 months or greater Total
Fair Value
Gross
Unrealized
Losses Fair Value
Gross
Unrealized
Losses Fair Value
Gross
Unrealized
Losses
(In thousands)
Corporate debt securities $ 205,679 $ (18) $ 312,541 $ (25) $ 518,220 $ (43)
Mortgage backed securities
issued by United States
government-sponsored
enterprises 8,921 - 157,432 (13
)
166,353 (13)
Debt securities of United
States government agencies 339,862 (18
)
156,343 (12
)
496,205 (30)
Total $ 554,462 $ (36) $ 626,316 $ (50) $ 1,180,778 $ (86)
87
Source: NVIDIA CORP, 10-K, March 18, 2010 Powered by Morningstar® Document Research℠