NVIDIA 2010 Annual Report Download - page 49
Download and view the complete annual report
Please find page 49 of the 2010 NVIDIA annual report below. You can navigate through the pages in the report by either clicking on the pages listed below, or by using the keyword search tool below to find specific information within the annual report.-
 1
1 -
2
-
3
-
4
-
5
-
6
-
7
-
8
-
9
-
10
-
11
-
12
-
13
-
14
-
15
-
16
-
17
-
18
-
19
-
20
-
21
-
22
-
23
-
24
-
25
-
26
-
27
-
28
-
29
-
30
-
31
-
32
-
33
-
34
-
35
-
36
-
37
-
38
-
 39
39 -
 40
40 -
 41
41 -
 42
42 -
 43
43 -
 44
44 -
 45
45 -
 46
46 -
 47
47 -
 48
48 -
 49
49 -
 50
50 -
 51
51 -
 52
52 -
 53
53 -
 54
54 -
 55
55 -
 56
56 -
 57
57 -
 58
58 -
 59
59 -
60
-
61
-
62
-
63
-
64
-
65
-
66
-
67
-
68
-
69
-
70
-
71
-
72
-
73
-
74
-
75
-
76
-
77
-
78
-
79
-
80
-
81
-
82
-
83
-
84
-
85
-
86
-
87
-
88
-
89
-
90
-
91
-
92
-
93
-
94
-
95
-
96
-
97
-
98
-
99
-
100
-
101
-
102
-
103
-
104
-
105
-
106
-
107
-
108
-
109
-
110
-
111
-
112
-
113
-
114
-
115
-
116
-
117
-
118
-
119
-
120
-
121
-
122
-
123
-
124
-
125
-
126
-
127
-
128
-
129
-
130
-
131
-
132
-
133
-
134
-
135
-
136
-
137
-
138
-
139
-
140
-
141
-
142
-
143
-
144
-
145
-
146
-
147
-
148
-
149
-
150
-
151
-
152
-
153
-
154
-
155
-
156
-
157
-
158
-
159
-
160
-
161
-
162
-
163
-
164
-
165
-
166
-
167
-
168
-
169
-
170
-
171
-
172
-
173
-
174
-
175
-
176
 |
 |

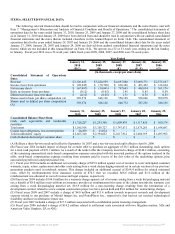
ITEM 6. SELECTED FINANCIAL DATA
The following selected financial data should be read in conjunction with our financial statements and the notes thereto, and with
Item 7, “Management’s Discussion and Analysis of Financial Condition and Results of Operations.” The consolidated statements of
operations data for the years ended January 31, 2010, January 25, 2009 and January 27, 2008 and the consolidated balance sheet data
as of January 31, 2010 and January 25, 2009 have been derived from and should be read in conjunction with our audited consolidated
financial statements and the notes thereto included elsewhere in this Annual Report on Form 10-K. The consolidated statement of
operations data for the years ended January 28, 2007 and January 29, 2006 and the consolidated balance sheet data for the years ended
January 27, 2008, January 28, 2007 and January 29, 2006 are derived from audited consolidated financial statements and the notes
thereto which are not included in this Annual Report on Form 10-K. We operate on a 52 or 53-week year, ending on the last Sunday
in January. Fiscal year 2010 was a 53-week year, while fiscal years 2009, 2008, 2007, and 2006 were 52-week years.
Year Ended
January 31, January 25, January 27, January 28, January 29,
2010
(B,C)
2009
(D)
2008
(E)
2007
(E, F)
2006
(G)
(In thousands, except per share data)
Consolidated Statement of Operations
Data:
Revenue $ 3,326,445 $ 3,424,859 $ 4,097,860 $ 3,068,771 $ 2,375,687
Income (loss) from operations $ (98,945) $ (70,700) $ 836,346 $ 453,452 $ 336,664
Net income (loss) $ (67,987) $ (30,041) $ 797,645 $ 448,834 $ 301,176
Basic net income (loss) per share $ (0.12) $ (0.05) $ 1.45 $ 0.85 $ 0.59
Diluted net income (loss) per share $ (0.12) $ (0.05) $ 1.31 $ 0.76 $ 0.55
Shares used in basic per share computation (A) 549,574 548,126 550,108 528,606 509,070
Shares used in diluted per share computation
(A) 549,574 548,126 606,732 587,256 548,556
January 31, January 25, January 27, January 28, January 29,
2010 2009 2008 2007 2006
Consolidated Balance Sheet Data:
Cash, cash equivalents and marketable
securities $ 1,728,227 $ 1,255,390 $ 1,809,478 $ 1,117,850 $ 950,174
Total assets $ 3,585,918 $ 3,350,727 $ 3,747,671 $ 2,675,263 $ 1,954,687
Capital lease obligations, less current portion $ 24,450 $ 25,634 $ - $ - $ -
Total stockholders’ equity $ 2,665,140 $ 2,394,652 $ 2,617,912 $ 2,006,919 $ 1,495,992
Cash dividends declared per common share $ - $ - $ - $ - $ -
(A) Reflects a three-for-two stock-split effective September 10, 2007 and a two-for-one stock-split effective April 6, 2006.
(B) Fiscal year 2010 includes impact of charge for a tender offer to purchase an aggregate of 28.5 million outstanding stock options
for a total cash payment of $78.1 million. As a result of the tender offer the Company incurred a charge of $140.2 million, consisting
of the remaining unamortized stock-based compensation expenses associated with the unvested portion of the options tendered in the
offer, stock-based compensation expense resulting from amounts paid in excess of the fair value of the underlying options, plus
associated payroll taxes and professional fees.
(C) Fiscal year 2010 includes an additional net warranty charge of $95.9 million against cost of revenue to cover anticipated customer
warranty, repair, return, replacement and other costs arising from a weak die/packaging material set in certain versions of our previous
generation products used in notebook systems. This charge included an additional accrual of $164.4 million for related estimated
costs, offset by reimbursements from insurance carriers of $70.5 that we recorded. $68.6 million and $1.9 million of the
reimbursement was allocated to cost of revenue and legal expense, respectively.
(D) Fiscal year 2009 includes $196.0 million for a warranty charge against cost of revenue arising from a weak die/packaging material
set; a benefit of $8.0 million received from an insurance provider as reimbursement for some of the claims towards the warranty cost
arising from a weak die/packaging material set; $18.9 million for a non-recurring charge resulting from the termination of a
development contract related to a new campus construction project we have put on hold and $8.0 million for restructuring charges.
(E) Fiscal years 2008 and 2007 include a charge of $4.0 million and $13.4 million towards in-process research and development
expense related to our purchase of Mental Images Inc. and PortalPlayer Inc., respectively, that had not yet reached technological
feasibility and have no alternative future use.
(F) Fiscal year 2007 included a charge of $17.5 million associated with a confidential patent licensing arrangement.
(G) Fiscal year 2006 included a charge of $14.2 million related to settlement costs associated with two litigation matters, 3dfx and
American Video Graphics, LP, or AVG.
Source: NVIDIA CORP, 10-K, March 18, 2010 Powered by Morningstar® Document Research℠