Mitsubishi 2012 Annual Report Download - page 7
Download and view the complete annual report
Please find page 7 of the 2012 Mitsubishi annual report below. You can navigate through the pages in the report by either clicking on the pages listed below, or by using the keyword search tool below to find specific information within the annual report.-
 1
1 -
 2
2 -
 3
3 -
 4
4 -
 5
5 -
 6
6 -
 7
7 -
 8
8 -
 9
9 -
 10
10 -
 11
11 -
 12
12 -
 13
13 -
 14
14 -
 15
15 -
 16
16 -
 17
17 -
 18
18 -
19
-
20
-
21
-
22
-
23
-
24
-
25
-
26
-
27
-
28
-
29
-
30
-
31
-
32
-
33
-
34
-
35
-
36
-
37
-
38
-
39
-
40
-
41
-
42
-
43
-
44
-
45
-
46
-
47
-
48
-
49
-
50
-
51
-
52
-
53
-
54
-
55
-
56
-
57
-
58
-
59
-
60
-
61
-
62
-
63
-
64
 |
 |

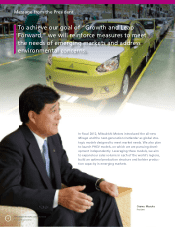
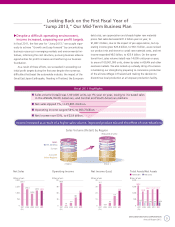
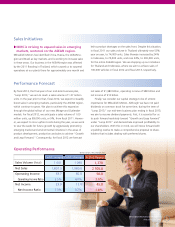
Despite a dif cult operating environment,
income increased, surpassing our pro t targets.
In scal 2011, the rst year for “Jump 2013,” we sought vigor-
ously to achieve “Growth and Leap Forward” by concentrating
business resources in emerging markets and environmental ini-
tiatives, reforming the cost structure, pursuing business alliance
opportunities for pro t increases and reinforcing our business
foundation.
As a result of these efforts, we succeeded in exceeding our
initial pro t targets during the rst year despite the numerous
dif culties that beset the automobile industry: the impact of the
Great East Japan Earthquake, ooding in Thailand, the European
debt crisis, yen appreciation and sharply higher raw materials
prices. Net sales decreased ¥21.2 billion year on year, to
¥1,807.3 billion, due to the impact of yen appreciation, but op-
erating income grew ¥23.4 billion, to ¥63.7 billion, as we revised
our product mix and strove to curtail raw materials costs, and net
income expanded ¥8.3 billion, to ¥23.9 billion. On the opera-
tional front, sales volume (retail) rose 14,000 units year on year,
to around 100,001,000 units, driven by sales in ASEAN and other
overseas markets. We also racked up a steady string of successes
in bolstering our strengths by preparing to commence production
of the all-new Mirage in Thailand and making the decision to
discontinue local production at a European production facility.
Fiscal 2011 Highlights
Sales volume (retail) was 1,001,000 units, up 1% year on year, owing to increased sales
in the ASEAN, North American, and Central and South American markets.
Net sales slipped 1%, to ¥1,807.3 billion.
Operating income surged 58%, to ¥63.7 billion.
Net income rose 53%, to ¥23.9 billion.
Income increased as a result of a higher sales volume, improved product mix and the effect of cost reductions
FY2011FY2010
Japa
n
North America
Europe
Asia and
Other Regions
(Thousands of units)
Sales Volume (Retail) by Region
218
511
987
164
94 218
1,001
152
106
525
Net Sales
0
750
1,500
2,250
3,000
20112010200920082007
(Billions of yen)
2,682.1
1,973.6
1,445.6
1,828.5 1,807.3
(FY)
0
30
60
90
120
20112010200920082007
Operating Income
(Billions of yen)
(FY)
108.6
3.9
13.9
40.3
63.7
Total Assets/Net Assets
(Billions of yen)
(FY)
0
500
1,000
1,500
2,000
20112010200920082007
1,609.4
328.1 223.0 234.5 248.1
328.1 223.0 234.5 248.1 265.6
1,138.0
1,258.7 1,312.5 1,321.3
Net assetsTotal assets
Net Income (Loss)
(Billions of yen)
(FY)
0
10
20
30
40
20112010200920082007
34.7
-54.9
4.8
15.6
23.9
Looking Back on the First Fiscal Year of
“Jump 2013,” Our Mid-Term Business Plan
MITSUBISHI MOTORS CORPORATION
Annual Report 2012 5