Mitsubishi 2012 Annual Report Download - page 18
Download and view the complete annual report
Please find page 18 of the 2012 Mitsubishi annual report below. You can navigate through the pages in the report by either clicking on the pages listed below, or by using the keyword search tool below to find specific information within the annual report.-
 1
1 -
2
-
3
-
4
-
5
-
6
-
7
-
 8
8 -
 9
9 -
 10
10 -
 11
11 -
 12
12 -
 13
13 -
 14
14 -
 15
15 -
 16
16 -
 17
17 -
 18
18 -
 19
19 -
 20
20 -
 21
21 -
 22
22 -
 23
23 -
 24
24 -
 25
25 -
 26
26 -
 27
27 -
 28
28 -
29
-
30
-
31
-
32
-
33
-
34
-
35
-
36
-
37
-
38
-
39
-
40
-
41
-
42
-
43
-
44
-
45
-
46
-
47
-
48
-
49
-
50
-
51
-
52
-
53
-
54
-
55
-
56
-
57
-
58
-
59
-
60
-
61
-
62
-
63
-
64
 |
 |

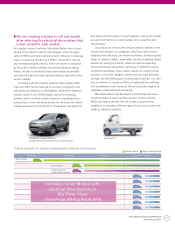
Spurred by sales in overseas markets, notably in the ASEAN region, the Company’s sales volume (retail) in
scal 2011 amounted to 1,001,000 units, up 14,000 vehicles, or 1%, from the preceding scal year. Con-
versely, wholesale volume declined 26,000 units, or 2% year on year, to 1,072,000 units, as shipments to
Europe declined on the back of growing credit uncertainty. Owing to the decline in wholesale volume
and the impact of yen appreciation, net sales slipped ¥21.2 billion, or 1%, to ¥1,807.3 billion.
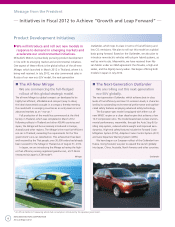
In scal 2012, we expect unit sales to decline in North America, as a result of our decision to cease
local production of D-segment vehicles. However, we expect unit sales to increase in Japan, Europe and
Asia and other regions, owing to the global rollout of the all-new Mirage and the next-generation
Outlander. Consequently, for scal 2012 we expect sales volume to rise 89,000 units, or 9%, from the
scal 2011 level, to 1,090,000 vehicles. We anticipate net sales of ¥1,980 billion.
By introducing new models in scal 2012,
we aim to increase sales volume and net sales.
Net Sales
(Billions of yen)
FY2010 FY2011 FY2012 (Forecast)
Japan 363.3 357.1 405.0
North America 189.8 195.2 170.0
Europe 490.0 474.8 445.0
Asia and Other Regions 785.4 780.2 960.0
Total 1,828.5 1,807.3 1,980.0
Operating Income (Loss)
(Billions of yen)
FY2010 FY2011 FY2012 (Forecast)
Japan 5.1 6.8 7.0
North America (27.9) (26.2) (26.0)
Europe (26.4) (15.6) (35.0)
Asia and Other Regions 89.5 98.7 134.0
Total 40.3 63.7 80.0
Sales Volume (Retail)
(Thousands of units)
FY2010 FY2011 FY2012 (Target)
Japan 164 152 167
North America 94 106 93
Europe 218 218 208
Asia and Other Regions 511 525 622
Total 987 1,001 1,090
0
500
1,000
1,500
2,000
2012
(Forecast)
20112010
(Billions of yen)
Japan North America Europe Asia and Other Regions
960.0
445.0
170.0
405.0
780.2
474.8
195.2
357.1
1,807.3
1,980.0
785.4
490.0
189.8
363.3
1,828.5
-150
-75
0
75
150
2012
(Forecast)
20112010
(Billions of yen)
Japan North America Europe Asia and Other Regions
8,800
134.0
98.7
6.8
7.0
(15.6)
63.7 80.0
89.5
5.1
40.3
(27.9)
(26.4)
(26.2) (26.0)
(35.0)
0
300
600
900
1,200
2012
(Target)
20112010
(Thousands of units)
Japan North America Europe Asia and Other Regions
622
208
93
167
525
218
106
152
1,001 1,090
511
218
94
164
987
Overview of Operations by Region
MITSUBISHI MOTORS CORPORATION
Annual Report 2012
16