Mercedes 2002 Annual Report Download - page 4
Download and view the complete annual report
Please find page 4 of the 2002 Mercedes annual report below. You can navigate through the pages in the report by either clicking on the pages listed below, or by using the keyword search tool below to find specific information within the annual report.-
 1
1 -
 2
2 -
 3
3 -
 4
4 -
 5
5 -
 6
6 -
 7
7 -
 8
8 -
 9
9 -
 10
10 -
 11
11 -
 12
12 -
 13
13 -
 14
14 -
 15
15 -
16
-
17
-
18
-
19
-
20
-
21
-
22
-
23
-
24
-
25
-
26
-
27
-
28
-
29
-
30
-
31
-
32
-
33
-
34
-
35
-
36
-
37
-
38
-
39
-
40
-
41
-
42
-
43
-
44
-
45
-
46
-
47
-
48
-
49
-
50
-
51
-
52
-
53
-
54
-
55
-
56
-
57
-
58
-
59
-
60
-
61
-
62
-
63
-
64
-
65
-
66
-
67
-
68
-
69
-
70
-
71
-
72
-
73
-
74
-
75
-
76
-
77
-
78
-
79
-
80
-
81
-
82
-
83
-
84
-
85
-
86
-
87
-
88
-
89
-
90
-
91
-
92
-
93
-
94
-
95
-
96
-
97
-
98
-
99
-
100
-
101
-
102
-
103
-
104
-
105
-
106
-
107
-
108
-
109
-
110
-
111
-
112
-
113
-
114
-
115
-
116
-
117
-
118
-
119
-
120
-
121
-
122
-
123
-
124
-
125
-
126
-
127
-
128
-
129
-
130
-
131
-
132
-
133
-
134
-
135
-
136
-
137
-
138
-
139
-
140
-
141
-
142
-
143
-
144
-
145
-
146
-
147
-
148
-
149
-
150
-
151
-
152
-
153
-
154
-
155
-
156
-
157
-
158
-
159
-
160
-
161
-
162
-
163
-
164
-
165
-
166
 |
 |

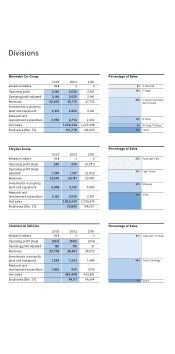
Divisions
Percentage of Sales
24%
24%
20%
32%
Passenger Cars
Light Trucks
Minivans
SUVs
Percentage of Sales
Vans (incl. V-Class)
Trucks/Unimogs
Buses5%
51 %
9%
Percentage of Sales
S-Class/SL
19% E-Class
39% C-Class/CLK/SLK/
Sport Coupe
14% A-Class
9% M-Class/G-Class
10% smart
44%
2001
3
2002
3
2002
US $
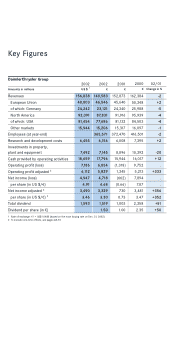
Amounts in millions
3,166
3,166
52,603
2,616
2,930
3,020
3,020
50,170
2,495
2,794
1.232,334
101,778
2,951
2,961
47,705
2,061
2,402
1,229,688
102,223
Mercedes Car Group
Operating profit
Operating profit adjusted1
Revenues
Investments in property,
plant and equipment
Research and
development expenditure
Unit sales
Employees (Dec. 31)
2001
3
2002
3
2002
US $
Amounts in millions
639
1,381
63,100
3,308
2,162
609
1,317
60,181
3,155
2,062
2,822,659
95,835
(5,281)
(2,183)
63,483
5,083
2,201
2,755,919
104,057
Chrysler Group
Operating profit (loss)
Operating profit (loss)
adjusted1
Revenues
Investments in property,
plant and equipment
Research and
development expenditure
Unit sales
Employees (Dec. 31)
2001
3
2002
3
2002
US $
Amounts in millions
(360)
185
29,778
1,324
1,006
(343)
176
28,401
1,263
959
485,408
94,111
(514)
51
28,572
1,484
1,015
492,851
96,644
Commercial Vehicles
Operating profit (loss)
Operating profit adjusted1
Revenues
Investments in property,
plant and equipment
Research and
development expenditure
Unit sales
Employees (Dec. 31)