Mercedes 2002 Annual Report Download - page 3
Download and view the complete annual report
Please find page 3 of the 2002 Mercedes annual report below. You can navigate through the pages in the report by either clicking on the pages listed below, or by using the keyword search tool below to find specific information within the annual report.-
 1
1 -
 2
2 -
 3
3 -
 4
4 -
 5
5 -
 6
6 -
 7
7 -
 8
8 -
 9
9 -
 10
10 -
 11
11 -
 12
12 -
 13
13 -
 14
14 -
15
-
16
-
17
-
18
-
19
-
20
-
21
-
22
-
23
-
24
-
25
-
26
-
27
-
28
-
29
-
30
-
31
-
32
-
33
-
34
-
35
-
36
-
37
-
38
-
39
-
40
-
41
-
42
-
43
-
44
-
45
-
46
-
47
-
48
-
49
-
50
-
51
-
52
-
53
-
54
-
55
-
56
-
57
-
58
-
59
-
60
-
61
-
62
-
63
-
64
-
65
-
66
-
67
-
68
-
69
-
70
-
71
-
72
-
73
-
74
-
75
-
76
-
77
-
78
-
79
-
80
-
81
-
82
-
83
-
84
-
85
-
86
-
87
-
88
-
89
-
90
-
91
-
92
-
93
-
94
-
95
-
96
-
97
-
98
-
99
-
100
-
101
-
102
-
103
-
104
-
105
-
106
-
107
-
108
-
109
-
110
-
111
-
112
-
113
-
114
-
115
-
116
-
117
-
118
-
119
-
120
-
121
-
122
-
123
-
124
-
125
-
126
-
127
-
128
-
129
-
130
-
131
-
132
-
133
-
134
-
135
-
136
-
137
-
138
-
139
-
140
-
141
-
142
-
143
-
144
-
145
-
146
-
147
-
148
-
149
-
150
-
151
-
152
-
153
-
154
-
155
-
156
-
157
-
158
-
159
-
160
-
161
-
162
-
163
-
164
-
165
-
166
 |
 |

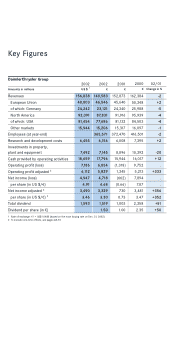
Key Figures
2001
3
2002
3
2002
US $ 1
Amounts in millions
156,838
48,803
24,242
92,091
81,454
15,944
6,455
7,492
18,659
7,18 6
6,112
4,947
4.91
3,490
3.46
1,593
DaimlerChrysler Group
Revenues
European Union
of which: Germany
North America
of which: USA
Other markets
Employees (at year-end)
Research and development costs
Investments in property,
plant and equipment
Cash provided by operating activities
Operating profit (loss)
Operating profit adjusted 2
Net income (loss)
per share (in US $/1)
Net income adjusted 2
per share (in US $/1) 2
Total dividend
Dividend per share (in 1)
1 Rate of exchange: 11 = US$1.0485 (based on the noon buying rate on Dec. 31, 2002).
2 To exclude one-time effects, see pages 68-73.
2000
3
02/01
Change in %
149,583
46,546
23,121
87,831
77,686
15,206
365,571
6,156
7,14 5
17,796
6,854
5,829
4,718
4.68
3,329
3.30
1,519
1.50
152,873
45,640
24,340
91,916
81,132
15,317
372,470
6,008
8,896
15,944
(1,318)
1,345
(662)
(0.66)
730
0.73
1,003
1.00
162,384
50,348
25,988
95,939
84,503
16,097
416,501
7,395
10,392
16,017
9,752
5,213
7,894
7.87
3,481
3.47
2,358
2.35
-2
+2
-5
-4
-4
-1
-2
+2
-20
+12
.
+333
.
.
+356
+352
+51
+50