McKesson 2005 Annual Report Download - page 8
Download and view the complete annual report
Please find page 8 of the 2005 McKesson annual report below. You can navigate through the pages in the report by either clicking on the pages listed below, or by using the keyword search tool below to find specific information within the annual report.-
 1
1 -
 2
2 -
 3
3 -
 4
4 -
 5
5 -
 6
6 -
 7
7 -
 8
8 -
 9
9 -
 10
10 -
 11
11 -
 12
12 -
 13
13 -
 14
14 -
 15
15 -
 16
16 -
 17
17 -
 18
18 -
 19
19 -
20
-
21
-
22
-
23
-
24
-
25
-
26
-
27
-
28
-
29
-
30
-
31
-
32
-
33
-
34
-
35
-
36
-
37
-
38
-
39
-
40
-
41
-
42
-
43
-
44
-
45
-
46
-
47
-
48
-
49
-
50
-
51
-
52
-
53
-
54
-
55
-
56
-
57
-
58
-
59
-
60
-
61
-
62
-
63
-
64
-
65
-
66
-
67
-
68
-
69
-
70
-
71
-
72
-
73
-
74
-
75
-
76
-
77
-
78
-
79
-
80
-
81
-
82
-
83
-
84
-
85
-
86
-
87
-
88
-
89
-
90
-
91
-
92
-
93
-
94
-
95
-
96
-
97
-
98
-
99
-
100
-
101
-
102
-
103
-
104
-
105
-
106
-
107
-
108
-
109
-
110
-
111
-
112
-
113
-
114
-
115
-
116
-
117
-
118
-
119
-
120
-
121
-
122
-
123
-
124
-
125
-
126
-
127
-
128
-
129
-
130
-
131
-
132
-
133
-
134
-
135
-
136
-
137
-
138
-
139
-
140
-
141
-
142
-
143
-
144
-
145
-
146
-
147
-
148
-
149
-
150
-
151
-
152
-
153
-
154
-
155
-
156
-
157
-
158
-
159
-
160
-
161
-
162
-
163
-
164
-
165
-
166
-
167
-
168
-
169
-
170
-
171
-
172
-
173
-
174
-
175
-
176
-
177
-
178
-
179
-
180
-
181
-
182
-
183
-
184
-
185
-
186
-
187
-
188
-
189
-
190
-
191
-
192
-
193
-
194
-
195
-
196
-
197
-
198
-
199
-
200
-
201
-
202
-
203
-
204
-
205
-
206
-
207
-
208
-
209
-
210
-
211
-
212
-
213
-
214
-
215
-
216
-
217
-
218
-
219
-
220
-
221
-
222
-
223
-
224
-
225
-
226
-
227
-
228
-
229
-
230
-
231
-
232
-
233
-
234
-
235
-
236
-
237
-
238
-
239
-
240
-
241
-
242
-
243
-
244
-
245
-
246
-
247
-
248
-
249
-
250
-
251
-
252
-
253
-
254
-
255
-
256
-
257
-
258
-
259
-
260
-
261
-
262
-
263
-
264
-
265
-
266
-
267
-
268
-
269
-
270
-
271
-
272
-
273
-
274
-
275
-
276
-
277
-
278
-
279
-
280
-
281
-
282
-
283
-
284
-
285
-
286
-
287
-
288
-
289
-
290
-
291
-
292
-
293
-
294
-
295
-
296
-
297
-
298
-
299
-
300
-
301
-
302
-
303
-
304
-
305
-
306
-
307
-
308
-
309
-
310
-
311
-
312
-
313
-
314
-
315
-
316
-
317
-
318
-
319
-
320
-
321
-
322
-
323
-
324
-
325
-
326
-
327
-
328
-
329
-
330
-
331
-
332
-
333
-
334
-
335
-
336
-
337
-
338
-
339
-
340
 |
 |

McKESSON CORPORATION
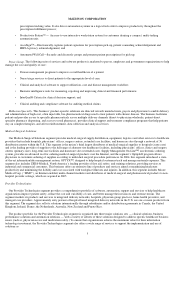
Suppliers. During 2005, the U.S. Healthcare pharmaceutical distribution and services business entered into restructured distribution
agreements with certain pharmaceutical manufacturers that modify the way we are compensated for our distribution and other related logistic
and administrative services and data. This transition in our business was due, in part, to increasing efforts by pharmaceutical manufacturers to
control or limit the product availability in the supply channels. Historically, a significant portion of the U.S. Healthcare’s gross margin has
been derived from purchasing branded product inventory in advance of pharmaceutical price increases and holding this inventory until a price
increase occurred, thereby generating a larger gross margin upon the sale of the product to customers (“Buy and Hold”). In more recent years,
we also entered into inventory management agreements (“IMA”) with certain manufacturers whereby we were paid for not building investment
inventories in advance of a price increase. Under both the Buy and Hold and IMA, gross margin dollars were predicated upon pharmaceutical
price increases which contributed to volatility in the U.S. Healthcare pharmaceutical distribution and services historical gross margins.
Throughout 2005, we have been actively working with pharmaceutical manufacturers to restructure our distribution agreements towards a
more fee-based approach whereby we are appropriately and predictably compensated for the services we provide. Under these fee-based
agreements, all or a significant portion of our compensation from pharmaceutical manufacturers is fixed and is no longer dependent upon
pharmaceutical price increases. We have made progress towards this objective and expect to be complete by mid-2006. Upon completion, we
expect more than 80% of our pharmaceutical manufacturer compensation will not be affected by price inflation.
Research and Development. Our research and development (“R&D”) expenditures primarily consist of our investment in software
development held for sale. We expended $231.5 million, $230.4 million, and $203.2 million for R&D activities in 2005, 2004 and 2003, and of
these amounts, we capitalized 21%, 25% and 26%. R&D expenditures are primarily incurred by our Provider Technologies segment, Payor
Group and Retail Automation businesses. Our Provider Technologies segment’s product development efforts apply computer technology and
installation methodologies to specific information processing needs of hospitals. We believe a substantial and sustained commitment to such
expenditures is important to the long-term success of this business. Additional information regarding our R&D activities is included in
Financial Note 1 to the consolidated financial statements, “Significant Accounting Policies,” appearing in this Annual Report on Form 10-K.
Environmental Legislation. We sold our chemical distribution operations in 1987 and retained responsibility for certain environmental
obligations. Agreements with the Environmental Protection Agency and certain states may require environmental assessments and cleanups at
several closed sites. These matters are described further in Item 3, “Legal Proceedings,” of this Annual Report on Form 10-K. Other than any
capital expenditures that may be required in connection with those legal matters, we do not anticipate making substantial capital expenditures
either for environmental issues, or to comply with environmental laws and regulations in the future. The amount of our capital expenditures for
environmental compliance was not material in 2005 and is not expected to be material in the next year.
Employees. On March 31, 2005, we employed approximately 25,200 persons compared to 24,600 in 2004 and 24,500 in 2003.
Financial Information About Foreign and Domestic Operations and Export Sales. Information as to foreign operations is included in
Financial Notes 1 and 22 to the consolidated financial statements, “Significant Accounting Policies” and “Segments of Business,” appearing in
this Annual Report on Form 10-K.
Item 2. Properties
Because of the nature of our principal businesses, plant, warehousing, office and other facilities are operated in widely dispersed locations.
The warehouses are typically owned or leased on a long-term basis. We consider our operating properties to be in satisfactory condition and
adequate to meet our needs for the next several years without making capital expenditures materially higher than historical levels. Information
as to material lease commitments is included in Financial Note 14 to the consolidated financial statements, “Lease Obligations,” appearing in
this Annual Report on Form 10-K.
8