McKesson 2005 Annual Report Download - page 20
Download and view the complete annual report
Please find page 20 of the 2005 McKesson annual report below. You can navigate through the pages in the report by either clicking on the pages listed below, or by using the keyword search tool below to find specific information within the annual report.-
 1
1 -
2
-
3
-
4
-
5
-
6
-
7
-
8
-
9
-
 10
10 -
 11
11 -
 12
12 -
 13
13 -
 14
14 -
 15
15 -
 16
16 -
 17
17 -
 18
18 -
 19
19 -
 20
20 -
 21
21 -
 22
22 -
 23
23 -
 24
24 -
 25
25 -
 26
26 -
 27
27 -
 28
28 -
 29
29 -
 30
30 -
31
-
32
-
33
-
34
-
35
-
36
-
37
-
38
-
39
-
40
-
41
-
42
-
43
-
44
-
45
-
46
-
47
-
48
-
49
-
50
-
51
-
52
-
53
-
54
-
55
-
56
-
57
-
58
-
59
-
60
-
61
-
62
-
63
-
64
-
65
-
66
-
67
-
68
-
69
-
70
-
71
-
72
-
73
-
74
-
75
-
76
-
77
-
78
-
79
-
80
-
81
-
82
-
83
-
84
-
85
-
86
-
87
-
88
-
89
-
90
-
91
-
92
-
93
-
94
-
95
-
96
-
97
-
98
-
99
-
100
-
101
-
102
-
103
-
104
-
105
-
106
-
107
-
108
-
109
-
110
-
111
-
112
-
113
-
114
-
115
-
116
-
117
-
118
-
119
-
120
-
121
-
122
-
123
-
124
-
125
-
126
-
127
-
128
-
129
-
130
-
131
-
132
-
133
-
134
-
135
-
136
-
137
-
138
-
139
-
140
-
141
-
142
-
143
-
144
-
145
-
146
-
147
-
148
-
149
-
150
-
151
-
152
-
153
-
154
-
155
-
156
-
157
-
158
-
159
-
160
-
161
-
162
-
163
-
164
-
165
-
166
-
167
-
168
-
169
-
170
-
171
-
172
-
173
-
174
-
175
-
176
-
177
-
178
-
179
-
180
-
181
-
182
-
183
-
184
-
185
-
186
-
187
-
188
-
189
-
190
-
191
-
192
-
193
-
194
-
195
-
196
-
197
-
198
-
199
-
200
-
201
-
202
-
203
-
204
-
205
-
206
-
207
-
208
-
209
-
210
-
211
-
212
-
213
-
214
-
215
-
216
-
217
-
218
-
219
-
220
-
221
-
222
-
223
-
224
-
225
-
226
-
227
-
228
-
229
-
230
-
231
-
232
-
233
-
234
-
235
-
236
-
237
-
238
-
239
-
240
-
241
-
242
-
243
-
244
-
245
-
246
-
247
-
248
-
249
-
250
-
251
-
252
-
253
-
254
-
255
-
256
-
257
-
258
-
259
-
260
-
261
-
262
-
263
-
264
-
265
-
266
-
267
-
268
-
269
-
270
-
271
-
272
-
273
-
274
-
275
-
276
-
277
-
278
-
279
-
280
-
281
-
282
-
283
-
284
-
285
-
286
-
287
-
288
-
289
-
290
-
291
-
292
-
293
-
294
-
295
-
296
-
297
-
298
-
299
-
300
-
301
-
302
-
303
-
304
-
305
-
306
-
307
-
308
-
309
-
310
-
311
-
312
-
313
-
314
-
315
-
316
-
317
-
318
-
319
-
320
-
321
-
322
-
323
-
324
-
325
-
326
-
327
-
328
-
329
-
330
-
331
-
332
-
333
-
334
-
335
-
336
-
337
-
338
-
339
-
340
 |
 |

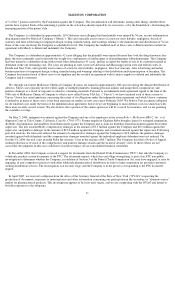
McKESSON CORPORATION
SCHEDULE II
SUPPLEMENTARY CONSOLIDATED FINANCIAL STATEMENT SCHEDULE
VALUATION AND QUALIFYING ACCOUNTS
For the Years Ended March 31, 2005, 2004 and 2003
(In millions)
20
Additions
Balance at Char
g
ed to Deductions
Beginning o
f
Costs and Charged to From Allowance
Balance at End
Description Year Expenses Other Accounts Accounts (1) of Year (2)
Year Ended March 31, 2005
Allowances for doubtful accounts $ 139.3 $ 15.6 $ 9.3 $ (47.7) (3) $ 116.5
Other allowances 37.5 9.5 5.1 (9.1)43.0
$ 176.8 $ 25.1 $ 14.4 $ (56.8) $ 159.5
Year Ended March 31, 2004
Allowances for doubtful accounts $ 261.1 $ 54.4(4) $ 0.4 $ (176.6) (3) $ 139.3
Other allowances 29.0 20.5 0.8 (12.8)37.5
$ 290.1 $ 74.9 $ 1.2 $ (189.4) $ 176.8
Year Ended March 31, 2003
Allowances for doubtful accounts $ 289.3 $ 68.5 $ 4.4 $ (101.1) (3) $ 261.1
Other allowances 30.0 13.4 0.2 (14.6) 29.0
$ 319.3 $ 81.9 $ 4.6 $ (115.7) $ 290.1
2005 2004 2003
(1) Deductions:
Written off $ 49.3 $ 122.6 $ 88.1
Credited to other accounts 7.5 66.8 27.6
Total $ 56.8 $ 189.4 $ 115.7
(2) Amounts shown as deductions from:
Current receivables $ 159.3 $ 176.8 $ 285.4
Notes receivable and other assets 0.2 — 4.7
Total $ 159.5 $ 176.8 $ 290.1
(3) Includes $4.0 million, $66.4 million and $22.3 million in 2005, 2004 and 2003 in reversals of the allowance for customer settlements
within our Provider Technologies segment.
(4) Includes a $30.0 million provision for a customer bankruptcy.