Marks and Spencer 2013 Annual Report Download - page 15
Download and view the complete annual report
Please find page 15 of the 2013 Marks and Spencer annual report below. You can navigate through the pages in the report by either clicking on the pages listed below, or by using the keyword search tool below to find specific information within the annual report.
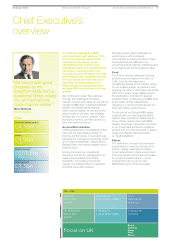
UK Mystery Shopping scores
Average score
81%
Analysis Mystery Shop scores remained high this
year at 81%. However, to help us be more in touch
with customers we plan to replace our monthly
Mystery Shop programme with a more regular,
in-depth customer satisfaction survey.
Annual space growth
2.8%
Analysis As consumers’ shopping habits change, we continue to evolve our
space selectively. We expect the planned opening of new space will add c.2%
to the UK in 2013/14.
Apr May Jun Jul Aug Sep Oct Nov Dec Jan Feb Mar
85
80
75
12/13
11/12
Marks and Spencer Group plc Annual report and financial statements 2013 13
Overview Financial review Governance Financial statements and other information
Strategic review
Chief Executive’s overview
Strategic review
Our products
Percentage of M&S products with a Plan A quality
2012/13
45%
14%
2011/12 31%
2015 target 50%
Why? Plan A qualities have been carefully chosen to be appealing to
customers, improve efficiency or make our supply chains more resilient.
Our people
Employee engagement scores
2012/13
78%
2%
2011/12 76%
Ongoing target 70%
Why? There is a strong correlation between high levels of engagement and
performance and as a result, we aim to maintain engagement levels of above
70%. We continue to use a variety of communication channels to ensure that
employees are engaged in our strategy and understand the role they play.
Become an international company
International revenue
£1,075.4m
4.5%
11/12 £1,066.1m
10/11 £1,007.3m
09/10 £968.7m
Analysis We are continuing to transform M&S into a more internationally
focused business and are making progress against our target of increasing
international sales by £300m to £500m by 2013/14.
12/13 £1,075.4m
11/12 £1,066.1m
10/11 £1,007.3m
09/10 £968.7m
Group profit before tax
£564.3m
14.2%
11/12 £658.0m
10/11 £780.6m
09/10 £702.7m
Group earnings per share
29.2p
10.2%
11/12 32.5p
10/11 38.8p
09/10 33.5p
Underlying earnings per share
32.7p
6.3%
11/12 34.9p
10/11 34.8p
09/10 33.0p
Return on capital employed
15.9%
3.0%
11/12 16.4%
10/11 16.7%
09/10 17.5%


