Marks and Spencer 2013 Annual Report Download - page 14
Download and view the complete annual report
Please find page 14 of the 2013 Marks and Spencer annual report below. You can navigate through the pages in the report by either clicking on the pages listed below, or by using the keyword search tool below to find specific information within the annual report.-
 1
1 -
2
-
3
-
 4
4 -
 5
5 -
 6
6 -
 7
7 -
 8
8 -
 9
9 -
 10
10 -
 11
11 -
 12
12 -
 13
13 -
 14
14 -
 15
15 -
 16
16 -
 17
17 -
 18
18 -
 19
19 -
 20
20 -
 21
21 -
 22
22 -
 23
23 -
 24
24 -
25
-
26
-
27
-
28
-
29
-
30
-
31
-
32
-
33
-
34
-
35
-
36
-
37
-
38
-
39
-
40
-
41
-
42
-
43
-
44
-
45
-
46
-
47
-
48
-
49
-
50
-
51
-
52
-
53
-
54
-
55
-
56
-
57
-
58
-
59
-
60
-
61
-
62
-
63
-
64
-
65
-
66
-
67
-
68
-
69
-
70
-
71
-
72
-
73
-
74
-
75
-
76
-
77
-
78
-
79
-
80
-
81
-
82
-
83
-
84
-
85
-
86
-
87
-
88
-
89
-
90
-
91
-
92
-
93
-
94
-
95
-
96
-
97
-
98
-
99
-
100
-
101
-
102
-
103
-
104
-
105
-
106
-
107
-
108
-
109
-
110
-
111
-
112
-
113
-
114
-
115
-
116
-
117
-
118
-
119
-
120
 |
 |

Performance
against our plan
Key Performance Indicators
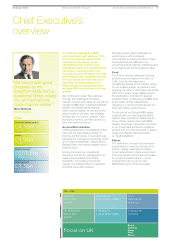
Focus on the UK
UK market share
Clothing and footwear
Value
11.2%
0.4% pts
Volume
12.0%
0.3% pts
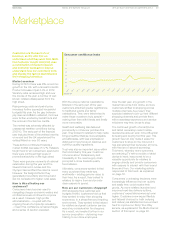
Analysis We remain the UK’s market leader in
clothing but have experienced a decline in market
share this year. We have set out a clear plan to
address our underperformance, reasserting our
quality and style credentials.
Kantar Worldpanel Clothing and Footwear share
52 w/e 14 April 2013.
UK market share
Food
Value
3.8%
Level
Analysis In a competitive market, our food market
share remained level, as customers continued to
trust M&S for responsibly sourced, quality food.
Kantar Worldpanel Food and Drink
52 w/e 14 April 2013.
Average weekly footfall
20.0m
1.5%
12/13 20.0m
11/12 20.3m
10/11 20.7m
09/10 21.0m
Analysis Visits to our stores were down slightly in
2012/13. However, this was in line with the wider
market trend, as customers increasingly adopted
a more multi-channel approach to shopping.
Concerns about rising petrol prices also impacted
footfall to stores.
Marks and Spencer Group plc Annual report and financial statements 2013 12Strategic review
Chief Executive’s overview
Plan A
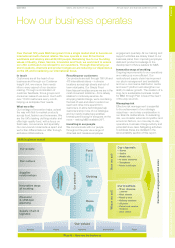
Our operations
UK & ROI greenhouse gas emissions
Gross (000 tonnes)
2012/13
569
23%
2006/07 735
Why? Reporting greenhouse gas emissions will become a legal requirement
from 2014. Reducing emissions improves efficiency and helps to respond to
the risks of climate change.
UK & ROI greenhouse gas emissions
Gross tonnes per sq ft of salesfloor
2012/13
34
37%
2006/07 54
2012 target 35
Why? Reporting greenhouse gas emissions per sq ft of salesfloor enables us to
monitor improvements in efficiency.
Become a leading multi-channel retailer
Multi-channel revenue
£651.8m
16.6%
11/12 £559.0m
10/11 £473.6m
09/10 £366.1m
Analysis As we strengthen our multi-channel capabilities, we continue to make
progress against our target to increase sales by £300m to £500m by 2013/14.
Percentage of population within a 30-minute drive of
a full line store
93%
level
Analysis To deliver a more multi-channel shopping experience we want to
have our stores in accessible locations and aim for 95% of the population to
be within a 30 minute drive of a full line store by 2015.
Financial performance
Group revenue
£10.0bn
1.3%
£m 09/10 10/11 11/12 12/13
UK 8,567.9 8,733.0 8,868.2 8,951.4
International 968.7 1,007.3 1,066.1 1,075.4
Total 9,536.6 9,740.3 9,934.3 10,026.8
Underlying Group profit before tax
£665.2m
5.8%
£m 09/10 10/11 11/12 12/13
UK operating profit 701.2 677.9 676.6 661.4
International operating profit 142.7 147.0 133.4 120.2
Net finance costs (149.3) (110.6) (104.1) (116.4)
Underlying Group profit
before tax
694.6 714.3 705.9 665.2