Marks and Spencer 2012 Annual Report Download - page 14
Download and view the complete annual report
Please find page 14 of the 2012 Marks and Spencer annual report below. You can navigate through the pages in the report by either clicking on the pages listed below, or by using the keyword search tool below to find specific information within the annual report.-
 1
1 -
2
-
3
-
 4
4 -
 5
5 -
 6
6 -
 7
7 -
 8
8 -
 9
9 -
 10
10 -
 11
11 -
 12
12 -
 13
13 -
 14
14 -
 15
15 -
 16
16 -
 17
17 -
 18
18 -
 19
19 -
 20
20 -
 21
21 -
 22
22 -
 23
23 -
 24
24 -
25
-
26
-
27
-
28
-
29
-
30
-
31
-
32
-
33
-
34
-
35
-
36
-
37
-
38
-
39
-
40
-
41
-
42
-
43
-
44
-
45
-
46
-
47
-
48
-
49
-
50
-
51
-
52
-
53
-
54
-
55
-
56
-
57
-
58
-
59
-
60
-
61
-
62
-
63
-
64
-
65
-
66
-
67
-
68
-
69
-
70
-
71
-
72
-
73
-
74
-
75
-
76
-
77
-
78
-
79
-
80
-
81
-
82
-
83
-
84
-
85
-
86
-
87
-
88
-
89
-
90
-
91
-
92
-
93
-
94
-
95
-
96
-
97
-
98
-
99
-
100
-
101
-
102
-
103
-
104
-
105
-
106
-
107
-
108
-
109
-
110
-
111
-
112
-
113
-
114
-
115
-
116
 |
 |

Performance
against our plan
Key Performance Indicators
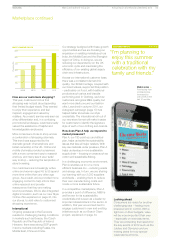
Analysis In a challenging
environment we maintained market
share, as we offered customers
greater choice at the same unrivalled
quality and value. More information
on our Clothing performance is set
out on page 18.
Kantar Worldpanel Clothing and Footwear
share 52 w/e 15 April 2012.
Analysis In a competitive market,
our food market share remained
level, as customers continued to
turn to M&S for great value and
quality. Our performance in Food
is detailed on page 21.
Kantar Worldpanel Food and Drink 52 w/e
15 April 2012. Analysis Visits to our stores were down slightly in 2011/12. However, this was
in line with the wider market, as customer concerns about rising petrol prices
impacted footfall to stores.
Focus on the UK
11.7% 20.3m 3.8%
12.4%
UK MARKET SHARE
clothing and footwear
AVERAGE WEEKLY FOOTFALLUK MARKET SHARE
food
Value
Volume
level 1.7%
level
level
11/12 20.3m
10/11 20.7m
09/10 21.0m
08/09 21.6m
Become a leading multi-channel retailer
Analysis As we continue to strengthen our multi-channel capabilities, we are
on track against our target to increase sales by £300m to £500m by 2013/14.
* Excluding VAT. Last year published including VAT.
Analysis Our aim is for 95% of the population to be within a 30 minute drive
of a full line store by 2015. This is helping us to deliver a leading multi-channel
shopping experience.
£559m* 93%
MULTI-CHANNEL SALES PERCENTAGE OF POPULATION WITHIN A 30-MINUTE DRIVE
OF A FULL LINE STORE
18% 10/11 (£473.6m)
09/10 (£366.1m)
08/09 (£290.1m)
Making Plan A how we do business
M&S UK and Republic of Ireland operated stores, offices, warehouses and
delivery fleet carbon emissions after deduction of carbon offsets effective
from 1 Jan 2012. Target of zero net emissions per 1,000 sq ft achieved from
1 Jan 2012.
Why carbon efficiency? Improving carbon efficiency reduces greenhouse
gas emissions and costs.
M&S UK and Republic of Ireland operated stores.
Why energy efficiency? Improving energy efficiency reduces greenhouse
gas emissions and costs and helps to comply with new legislation introduced
in 2011.
53 27 49% 67.9 49.1 28%
051.0
NET CARBON EFFICIENCY
(IN TONNES CO2e PER 1,000 SQ FT OF SALESFLOOR)
IMPROVE STORE ENERGY EFFICIENCY
IN KWH PER SQ FT OF SALESFLOOR
2006/07 2006/072012 target 2012 target2011/12 2011/12Improvement Improvement
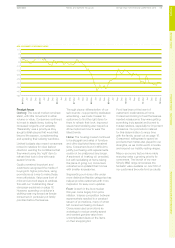
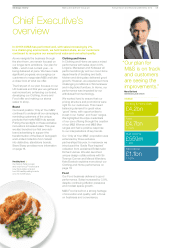
Financial performance
GROUP REVENUE UNDERLYING GROUP OPERATING PROFIT
£9.9bn 2.0%
£m 08/09 09/10 10/11 11/12
UK 8,164.3 8,567.9 8,733.0 8,868.2
International 897.8 968.7 1,007.3 1,066.1
Total 9,062.1 9,536.6 9,740.3 9,934.3
In November 2010 we set out a target to grow our revenues by £1.5bn
to £2.5bn over the next three years. As a result of the deterioration in
the economic environment since we set out our plan, we now expect
to achieve a £1.1bn to £1.7bn increase in revenues.
£810.0m 1.8%
£m 08/09 09/10 10/11 11/12
UK 652.8 701.2 677.9 676.6
International 116.1 142.7 147.0 133.4
Total 768.9 843.9 824.9 810.0
Marks and Spencer Group plc Annual report and financial statements 2012 12Strategic review
Chief Executive’s overview