Marks and Spencer 2003 Annual Report Download - page 8
Download and view the complete annual report
Please find page 8 of the 2003 Marks and Spencer annual report below. You can navigate through the pages in the report by either clicking on the pages listed below, or by using the keyword search tool below to find specific information within the annual report.-
 1
1 -
 2
2 -
 3
3 -
 4
4 -
 5
5 -
 6
6 -
 7
7 -
 8
8 -
 9
9 -
 10
10 -
 11
11 -
 12
12 -
 13
13 -
 14
14 -
 15
15 -
 16
16 -
 17
17 -
 18
18 -
 19
19 -
20
-
21
-
22
-
23
-
24
-
25
-
26
-
27
-
28
-
29
-
30
-
31
-
32
-
33
-
34
-
35
-
36
-
37
-
38
-
39
-
40
-
41
-
42
-
43
-
44
-
45
-
46
-
47
-
48
-
49
-
50
-
51
-
52
-
53
-
54
-
55
-
56
 |
 |

6Marks and Spencer Gro up p.l.c.
Financial review
The introduction of a revised bad debt methodology resulted in a one-off increase in bad debt charges in the second half
of last year. Declining customer balances and the absence of that one-off charge, together with the implementation of
improved collection procedures, have resulted in the bad debt charge for the year being £20.5m lower than last year.
In order to combat falling income levels, a programme of cost reduction was initiated which resulted in a decrease in
operating costs for the existing retailing activities of £10.4m. The reduction in operating costs and bad debt charges more
than offset the decline in net income and resulted in operating profit for the existing business increasing by 26%. This strong
increase in profitability financed the additional investment during the year of approximately £25m in the credit card and
loyalty programme.
Credit card and loyalty pilot
We began a trial in September 2002 in South Wales to validate the business case and our operational capability to deliver
a joint credit and loyalty card for our customers.
The key measures we assessed were the take-up of the new card, average balances, the number of new cardholders,
propensity to borrow, card penetration and incremental sales. On each of these measures, the pilot was successful.
Therefore we are progressing with the necessary commitments for a national roll-out in the second half of the year.
Total revenue costs incurred on the card and loyalty programme during the year amounted to approximately £25m. These
costs covered the development of technological and operational infrastructure as well as the costs of running the pilot.
The revenue cost of rolling out the card and loyalty programme will be approximately £60m in the current financial year.
This covers: the cost of developing further infrastructure associated with becoming a major new credit card provider; the
cost of providing customer service capability; and acquisition and card issue costs up to and through the national launch.
The costs of the development of the credit and loyalty card will mean that Financial Services profit will reach a low point in
2003/04 and grow from that base in 2004/05.
Discontinued operations
Last year, we closed the Continental European operations and sold Brooks Brothers. The results of these businesses up until
the dates of closure or disposal are reported under discontinued operations.
Interest
Net interest expense was £40.5m compared to net income of £17.6m last year. This arises as a result of the increase in debt
following the capital restructuring of the Group at the end of last year, when £1.7bn was returned to shareholders.
Taxation
The tax charge for the year of £197.4m, reflects an effective tax rate before exceptional charges of 28.6% compared to
29.6% last year. This rate is less than the UK corporation tax rate of 30%, largely as a result of prior year contributions
to European subsidiary closure costs being accepted as tax deductible in the UK.
Earnings per share
Adjusted earnings per share was 22.2p (last year 15.9p) and is calculated to exclude the effect of exceptional items. Details
of the calculation are given in note 9 to the financial statements.
Dividend
A final dividend of 6.5p (last year 5.8p) is proposed, making the total dividend for the year 10.5p (last year 9.5p).
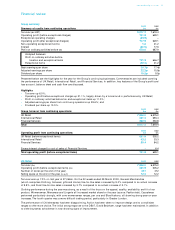
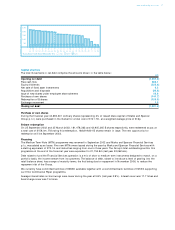
Cash flow
Analysis of free cash flow (operating cash flow before acquisitions and disposals and transactions with shareholders) is
as follows:
2003 2002
Cash flow analysis £m £m
Cash inflow from Retail operating activities 848.8 853.5
Cash inflow from Financial Services operating activities 319.9 240.2
Capital expenditure (324.5) (285.7)
Proceeds from asset disposals 25.0 455.6
Net interest (paid)/received (46.2) 36.8
Tax paid (216.9) (179.4)
Free cash flow 606.1 1,121.0
The cash inflow from Financial Services operating activities is stated after a £167.1m decrease this year (last year a £76.2m
decrease) in loans and advances to customers.
During the year, the Group acquired tangible fixed assets totalling £311.0m (last year £290.5m). After taking into account
the timing of payments, the cash outflow for capital expenditure was £324.5m (last year £285.7m).