Marks and Spencer 2003 Annual Report Download - page 18
Download and view the complete annual report
Please find page 18 of the 2003 Marks and Spencer annual report below. You can navigate through the pages in the report by either clicking on the pages listed below, or by using the keyword search tool below to find specific information within the annual report.-
 1
1 -
2
-
3
-
4
-
5
-
6
-
7
-
 8
8 -
 9
9 -
 10
10 -
 11
11 -
 12
12 -
 13
13 -
 14
14 -
 15
15 -
 16
16 -
 17
17 -
 18
18 -
 19
19 -
 20
20 -
 21
21 -
 22
22 -
 23
23 -
 24
24 -
 25
25 -
 26
26 -
 27
27 -
 28
28 -
29
-
30
-
31
-
32
-
33
-
34
-
35
-
36
-
37
-
38
-
39
-
40
-
41
-
42
-
43
-
44
-
45
-
46
-
47
-
48
-
49
-
50
-
51
-
52
-
53
-
54
-
55
-
56
 |
 |

16 Marks and Spencer Gro up p.l.c.
Remuneration report
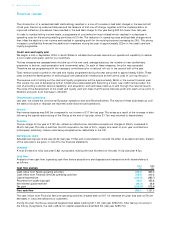
Performance graph
This graph illustrates the performance of the Company against the FTSE 100 over the past five years. The FTSE 100 has been
chosen as it is a recognised broad equity market index of which the Company has been a member throughout the period.
Performance, as required by the legislation, is measured by Total Shareholder Return (share price growth plus dividends paid).
Total shareholder return
1 Directors’ emoluments Current
annual Termination Total Total
salary/fee Salary/fee Benefits Bonus payments 2003 2002
£000 £000 £000 £000 £000 £000 £000
Chairman
Luc Vandevelde 420 630 478 617 – 1,725 2,234
Chief Executive
Roger Holmes 600 538 109 491 – 1,138 914
Executive directors (appointed from)
Justin King (1 September 2002) 300 175 35 160 – 370 n/a
David Norgrove 330 307 20 268 – 595 570
Laurel Powers-Freeling (6 November 2001) 340 325 71 303 – 699 333
Vittorio Radice (3 March 2003)1425 35 875 290 – 1,200 n/a
Alison Reed (11 July 2001) 350 335 54 306 – 695 504
Non-executive directors (appointed from)
Brian Baldock 34 34 – – –34 34
Jack Keenan (1 September 2001) 34 34 – – –34 20
Kevin Lomax 34 34 – – –34 34
Paul Myners (2 April 2002) 34 34 – – –34n/a
Dame Stella Rimington 50 50 – – –50 50
Retired directors (retirement date)
Alan McWalter (10 July 2002)2100 25 90 451 666 651
Tony Ball (4 September 2002) 15–––
15 34
Former directors n/a n/a n/a n/a n/a 1,007
Total 2,646 1,667 2,525 451 7,289 6,385
1Details of package for Vittorio Radice are shown in section 2.
2Alan McWalter retired from the Board on 10 July 2002. His termination payment includes one year’s salary of £300,000 and £151,000 for loss of
benefits which includes bonus, car benefits, pension supplement and loss of pensionable service.
The annual bonus scheme this year has been awarded at a range of 87% to 98% of base salary dependent on the delivery
of personal business targets and the financial measure of profit before tax. The bonus figure in the emoluments table is
inclusive of the amounts compulsorily and voluntarily invested in shares for the purposes of the Share Matching Plan.
Luc Vandevelde does not participate in this plan.
The benefits shown in the emoluments table include the provision of cars, fuel and travel for executive directors. Pension
supplements are paid to Luc Vandevelde, of 16% of salary and Vittorio Radice, of 25% of salary as they do not participate
in the Marks & Spencer Pension Scheme. A 10% supplement, in respect of the difference between the pensions earnings
cap and their base salary (see section 3) is paid to Roger Holmes, Justin King, Laurel Powers-Freeling and was paid to Alan
McWalter. In addition, under the terms of Luc Vandevelde’s service contract, the Company provides accommodation whilst
he is in London on which he is assessed for tax. Accommodation is also provided for Laurel Powers-Freeling in Chester, to
accommodate her working pattern (two days in London, three days in Chester – the location of our Financial Services
operation). A taxable benefit arises from this which is met by the Company. Luc Vandevelde, Roger Holmes and Alison
Reed received a cash sum in lieu of the dividends waived on shares which vested under the Restricted Share Plan.
Marks & Spencer FTSE 100 Index
140
120
80
60
100
40
20
0
29 Mar 98 29 Mar 99 29 Mar 00 29 Mar 01 29 Mar 02 29 Mar 03
The above graph looks at the value, at the end of the 2002/03 financial year, of £100 invested in Marks & Spencer shares at the end of the 1997/98 financial year
compared with the value of £100 invested in the FTSE 100 Index over the same period. The other points plotted are the values at intermediate financial year-ends.
Source: Datastream