Marks and Spencer 2003 Annual Report Download - page 6
Download and view the complete annual report
Please find page 6 of the 2003 Marks and Spencer annual report below. You can navigate through the pages in the report by either clicking on the pages listed below, or by using the keyword search tool below to find specific information within the annual report.-
 1
1 -
 2
2 -
 3
3 -
 4
4 -
 5
5 -
 6
6 -
 7
7 -
 8
8 -
 9
9 -
 10
10 -
 11
11 -
 12
12 -
 13
13 -
 14
14 -
 15
15 -
 16
16 -
 17
17 -
18
-
19
-
20
-
21
-
22
-
23
-
24
-
25
-
26
-
27
-
28
-
29
-
30
-
31
-
32
-
33
-
34
-
35
-
36
-
37
-
38
-
39
-
40
-
41
-
42
-
43
-
44
-
45
-
46
-
47
-
48
-
49
-
50
-
51
-
52
-
53
-
54
-
55
-
56
 |
 |

4Marks and Spencer Gro up p.l.c.
Financial review
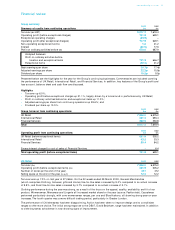
We are continuing to realise gains in our primary margin as a result of actions taken to increase overseas production
and consolidate our supply base. For the full year this delivered a further 1.3 percentage point improvement in the
Clothing bought-in margin. In addition, markdowns as a percentage of sales were lower than last year, leading to a further
0.3 percentage point improvement in the Clothing achieved margin. In absolute terms markdowns were higher than
planned and largely arose within Womenswear during the autumn season, where we drove for high sales growth and
improved availability, and in Childrenswear.
Distribution costs, which are included in cost of sales, increased marginally less than the rate of sales growth. Following a
review of the general merchandise logistics operation, we recently announced the closure of our Hayes distribution centre
and a reduction in the number of warehousing contractors from four to two. These changes, which are expected to generate
annual savings of £20m, have resulted in an exceptional charge of £36.3m in the year.
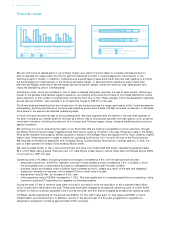
The Home business benefited from the introduction of new products across the range, particularly within home accessories
and bedding, and the performance of furniture was helped by events around bank holidays. However, a reduction in allocated
store space in the second half affected underlying sales.
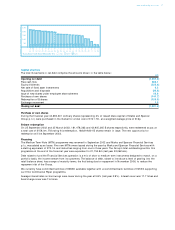
In Food, we have had another year of strong sales growth. We have outperformed the market in the last three quarters of
the year, increasing our market share for the year as a whole. Key to this success has been the high quality of our products,
continued innovation including the relaunch of our Indian and Chinese ranges, strong, cohesive marketing and a focus on
special occasions.
We continue to focus on extending the reach of our Food offer. We are making it accessible to more customers, through
the Simply Food format and larger neighbourhood Food stores, opening 15 stores in the year. Progress to date in the Simply
Food stores has been encouraging, delivering sales in excess of the average return per square foot for Food, offset by slightly
higher costs. These stores are on target to deliver an operating profit which is in line with the rest of the Food business.
We have also extended the agreement with Compass Group to place Simply Food stores in railway stations. In total, we
plan to have opened 150 Simply Food stores by March 2006.
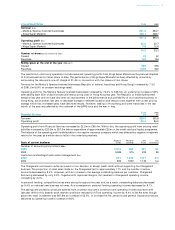
We have invested further in the in-store environment and have now modernised 256 stores, representing approximately
93% of UK Retail selling space. There are now 141 Café Revive coffee shops in stores; these have contributed almost £80m
to turnover (inc. VAT) this year.
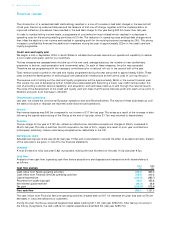
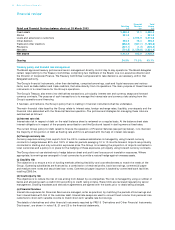
Operating costs of £1,863m, excluding exceptional charges, increased by 4.9% over the same period last year:
• employee costs which, at £975m, represent over half of total operating costs increased by 1.8%. Included in this is
the anticipated cost of performance bonuses for management and store staff this year is £34m;
• property, repair and renewal costs of £335m have increased by 8.0%, largely as a result of the sale and leaseback
transaction entered into last year, which added £15m to rental costs this year;
• depreciation was £218m, an increase of 4.9%; and
• other operating costs of £335m increased by 11.9%. This was largely due to increased expenditure on marketing, rising
insurance costs and IT expenditure to upgrade our business systems.
During the year, £7.6m of revenue costs were incurred in connection with the relocation of the corporate head office,
which is planned to take place next year. These costs have been charged as exceptional operating costs. A further £25m
to £30m of revenue costs are expected to be incurred next year and will also be charged as exceptional operating costs.
UK Retail capital expenditure for the period was £303m. Of this, £81m was spent on new space and £96m on store
modernisation and refurbishment. In addition, we are in the second year of a five year programme to upgrade our
refrigeration equipment, investing approximately £40m annually.
Clothing Home Food
15
5
0
10
-5
UK Retail sales performance per quarter against last year %
14 weeks
to 6 July 12 weeks
to 28 Sept 15 weeks
to 11 Jan 11 weeks
to 29 March 52 weeks
to 29 March
Depreciation Other costs
2003
2002
Employee costs Property and equipment
UK Retail operating costs £m
£1,863m
£1,776m