Marks and Spencer 2003 Annual Report Download - page 7
Download and view the complete annual report
Please find page 7 of the 2003 Marks and Spencer annual report below. You can navigate through the pages in the report by either clicking on the pages listed below, or by using the keyword search tool below to find specific information within the annual report.-
 1
1 -
 2
2 -
 3
3 -
 4
4 -
 5
5 -
 6
6 -
 7
7 -
 8
8 -
 9
9 -
 10
10 -
 11
11 -
 12
12 -
 13
13 -
 14
14 -
 15
15 -
 16
16 -
 17
17 -
 18
18 -
19
-
20
-
21
-
22
-
23
-
24
-
25
-
26
-
27
-
28
-
29
-
30
-
31
-
32
-
33
-
34
-
35
-
36
-
37
-
38
-
39
-
40
-
41
-
42
-
43
-
44
-
45
-
46
-
47
-
48
-
49
-
50
-
51
-
52
-
53
-
54
-
55
-
56
 |
 |

www.marksandspencer.co m 5
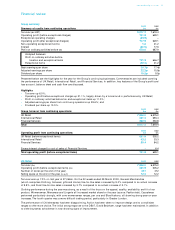
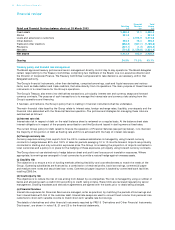
International Retail 2003 2002
Turnover (£m)
– Marks & Spencer branded businesses 391.2 364.7
– Kings Super Markets 290.1 328.7
681.3 693.4
Operating profit(£m)
– Marks & Spencer branded businesses 35.6 20.7
– Kings Super Markets 7.9 12.6
43.5 33.3
Number of stores (at the end of the year)
Owned 43 42
Franchise 152 133
Selling space at the end of the year (’000 sq ft)
Owned 948 955
Franchise 1,024 920
The results from continuing operations include sales and operating profits from Kings Super Markets as the planned disposal
of this business has not taken place to date. The performance of Kings Super Markets has been affected by uncertainty
surrounding the sale and a one-off charge of £1.4m in connection with the closure of two stores.
Turnover for the Marks & Spencer branded businesses (Republic of Ireland, franchises and Hong Kong) increased by 7.3%
to £391.2m (6.9% at constant exchange rates).
Operating profit for the Marks & Spencer branded businesses increased by 72.0% to £35.6m, an underlying increase of 39%
after adding back £5m of abortive sale and restructuring costs in Hong Kong last year. The Republic of Ireland performed
ahead of last year and we have also seen an improvement in the performance and profitability of our franchise business. In
Hong Kong, actions taken last year to decrease footage in selected locations and reduce costs, together with a new pricing
strategy which has increased sales, have delivered results. However, trading in Hong Kong and some franchises in the last
month of the year was affected by the outbreak of the SARS virus and the war in Iraq.
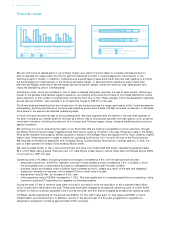
2003 2002
Financial Services £m £m
Turnover 329.9 350.8
Operating profit 86.4 84.2
Operating profit from Financial Services increased by £2.2m to £86.4m. Within this, the operating profit from existing retail
activities increased by £20.2m to £97.5m before expenditure of approximately £25m on the credit card and loyalty programme.
The balance of the operating profit is attributable to the captive insurance company which was affected by negative investment
returns for the year as a whole due to falls in the underlying markets.
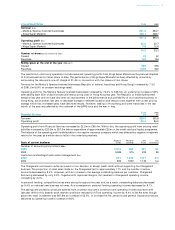
Account Personal Unit Life
Scale of current business Cards Lending Trusts Assurance
Number of accounts/policy holders (000s)
2003 5,016 488 227 90
2002 5,089 515 223 89
Customer outstandings/funds under management (£m)
2003 631 1,385 1,017 n/a
2002 653 1,530 1,140 n/a
The Chargecard continues to suffer as a result of our decision to accept credit cards without supporting the Chargecard
business. The proportion of retail sales made on the Chargecard fell to approximately 17% and the number of active
accounts decreased by 8.2%. However, with an increase in the average outstanding balance per customer, Chargecard
borrowing decreased by only 3.2%. Together with improved margins, this resulted in Chargecard operating income
increasing by 2.0%.
In personal lending, competitive forces were strong throughout the year and, as a result, outstanding balances decreased
by 9.4% on reduced new business volumes. As a consequence, personal lending operating income decreased by 9.1%.
The savings and protection products suffered from uncertain economic conditions and operating income was level with
last year. Within this, bearish stock market conditions reduced Unit Trust operating income by 9.4% to £9.9m even though
gross new retail investment was £87.8m an increase of 53.5%. In contrast the life, pensions and general insurance products
delivered an operating income increase of 8.6%.