JVC 2009 Annual Report Download - page 3
Download and view the complete annual report
Please find page 3 of the 2009 JVC annual report below. You can navigate through the pages in the report by either clicking on the pages listed below, or by using the keyword search tool below to find specific information within the annual report.-
 1
1 -
 2
2 -
 3
3 -
 4
4 -
 5
5 -
 6
6 -
 7
7 -
 8
8 -
 9
9 -
 10
10 -
 11
11 -
 12
12 -
 13
13 -
 14
14 -
15
-
16
-
17
-
18
-
19
-
20
-
21
-
22
-
23
-
24
-
25
-
26
-
27
-
28
-
29
-
30
-
31
-
32
 |
 |

1
JVC KENWOOD Holdings, Inc.
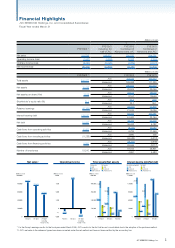
Financial Highlights
JVC KENWOOD Holdings, Inc. and Consolidated Subsidiaries
Fiscal Year ended March 31
(Millions of yen)
*2
FYE’09/3 *1
FYE’09/3
Including 1st
half of JVC
FYE’08/3
Combined of
Kenwood and JVC
FYE’07/3
Combined of
Kenwood and JVC
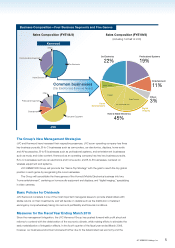
Net sales 311,299 545,603 755,833 844,591
Operating income (loss) (1,537) (4,006) 8,988 (2,255)
Ordinary income (loss) (9,760) (16,525) (4,832) (11,571)
Net income (loss) (30,735) (42,890) (43,481) (10,945)
(Millions of yen)
FYE’09/3 *1 FYE’08/3 FYE’07/3
Total assets 344,077 JVC 311, 272 415,643
Kenwood 126,088 111,220
Net assets 74,4 39 JVC 108,696 12 7, 2 2 3
Kenwood 29,925 39,066
Net assets per share (Yen) 75.08 JVC 294.01 489.38
Kenwood 81.57 106.46
Stockholder’s equity ratio (%) 21.1 JVC 34.2 29.9
Kenwood 23.7 35.1
Retained earnings (10,765) JVC (15,847) 30,816
Kenwood 21,534 19,096
Interest-bearing debt 13 4,10 0 JVC 69,646 120,481
Kenwood 51,420 23,754
Net debt 81,683 JVC 26,416 50,459
Kenwood 36,432 6,782
Cash flows from operating activities 10,425 JVC (9,433) 12,094
Kenwood 6,784 11,456
Cash flows from investing activities (11,288) JVC 3,880 405
Kenwood (34,589) (5,218)
Cash flows from financing activities 9,265 JVC (18,370) (4,949)
Kenwood 26,565 (3,717)
Number of employees 19,540 JVC 19,044 26,851
Kenwood 4,691 4,483
*1. In the Group’s earnings results for the fiscal year ended March 2009, JVC’s results for the first half are not consolidated due to the adoption of the purchase method.
*2. JVC’s net sales in the reference figures have been converted under the net method and have not been certified by the accounting firm.
Net sales Operating income
Interest-bearing debt/Net debt
Total assets/Net assets
(Millions of yen) (Millions of yen) (Millions of yen) (Millions of yen)
FYE’07/3 FYE’08/3 FYE’09/3
Including
1st half of JVC
Including
1st half of JVC
FYE’07/3 FYE’08/3 FYE’09/3 FYE’07/3 FYE’08/3 FYE’09/3
Interest-bearing debt Net debt
JVC
Kenwood
JVC Kenwood
JVC
Kenwood
JVC Kenwood
JVC
Kenwood
JVC Kenwood
JVC
Kenwood
JVC Kenwood
Total assets Net assets
FYE’07/3 FYE’08/3 FYE’09/3
*2
1,000,000
800,000
600,000
400,000
200,000
0
10,000
7,500
5,000
2,500
0
-5,000
600,000
480,000
360,000
240,000
120,000
0
150,000
120,000
90,000
60,000
30,000
0
844,591
755,833
545,603
-2,255
8,988
-4,006
23,754
51,420
134,100
120,481
69,646
50,459
6,782
26,416
36,432
81,683
39,066 29,925
111,220
74,439
344,077
126,088
108,696
311,272
127,222
415,643