Goldman Sachs 2004 Annual Report Download - page 2
Download and view the complete annual report
Please find page 2 of the 2004 Goldman Sachs annual report below. You can navigate through the pages in the report by either clicking on the pages listed below, or by using the keyword search tool below to find specific information within the annual report.-
 1
1 -
 2
2 -
 3
3 -
 4
4 -
 5
5 -
 6
6 -
 7
7 -
 8
8 -
 9
9 -
 10
10 -
 11
11 -
 12
12 -
 13
13 -
14
-
15
-
16
-
17
-
18
-
19
-
20
-
21
-
22
-
23
-
24
-
25
-
26
-
27
-
28
-
29
-
30
-
31
-
32
-
33
-
34
-
35
-
36
-
37
-
38
-
39
-
40
-
41
-
42
-
43
-
44
-
45
-
46
-
47
-
48
-
49
-
50
-
51
-
52
-
53
-
54
-
55
-
56
-
57
-
58
-
59
-
60
-
61
-
62
-
63
-
64
-
65
-
66
-
67
-
68
-
69
-
70
-
71
-
72
-
73
-
74
-
75
-
76
-
77
-
78
-
79
-
80
-
81
-
82
-
83
-
84
-
85
-
86
-
87
-
88
-
89
-
90
-
91
-
92
-
93
-
94
-
95
-
96
-
97
-
98
-
99
-
100
-
101
-
102
-
103
-
104
-
105
-
106
-
107
-
108
-
109
-
110
-
111
-
112
-
113
-
114
-
115
-
116
-
117
-
118
-
119
-
120
 |
 |

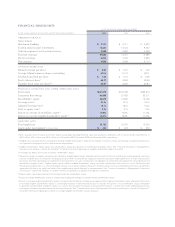
financialhighlights
ASOFORFORTHEYEARENDEDNOVEMBER
($ANDSHAREAMOUNTSINMILLIONS,EXCEPTPERSHAREAMOUNTS) 2004 2003 2002
operatingresults
Net revenues
Investment banking $ 3,374 $ 2,711 $ 2,830
Trading and principal investments 13,327 10,443 8,647
Asset management and securities services 3,849 2,858 2,509
Total net revenues 20,550 16,012 13,986
Pre-tax earnings 6,676 4,445 3,253
Net earnings 4,553 3,005 2,114
commonsharedata
Diluted earnings per share $ 8.92 $ 5.87 $ 4.03
Average diluted common shares outstanding 510.5511.9 525.1
Dividends declared per share $ 1.00 $ 0.74 $ 0.48
Book value per share(1) 50.7743.60 38.69
Tangible book value per share(2)(3) 40.9133.56 28.84
financialconditionandotheroperatingdata
Total assets $531,379 $403,799 $355,574
Long-term borrowings 80,69657,482 38,711
Shareholders’ equity 25,07921,632 19,003
Leverage ratio(4) 21.2x 18.7x 18.7x
Adjusted leverage ratio(5) 15.1x 16.5x 15.2x
Debt to equity ratio(6) 3.2x 2.7x 2.0x
Return on average shareholders’ equity(7) 19.8% 15.0% 11.3%
Return on average tangible shareholders’ equity(8) 25.2% 19.9% 15.3%
selecteddata
Total employees 20,722 19,476 19,739
Assets under management ($INBILLIONS) $ 452 $ 373 $ 348
(1)
Bookvaluepershareisbasedoncommonsharesoutstanding,includingrestrictedstockunitsgrantedtoemployeeswithnofutureservicerequirements,of
494.0million,496.1millionand491.2millionasofNovember2004,November2003andNovember2002,respectively.
(2)
Tangiblebookvaluepershareiscomputedbydividingtangibleshareholders’equitybythenumberofcommonsharesoutstanding,includingrestrictedstock
unitsgrantedtoemployeeswithnofutureservicerequirements.
(3)
Tangible shareholders’equity equalstotal shareholders’equity lessgoodwill andidentifiable intangibleassets. See“Financial Information—Management’s
DiscussionandAnalysis—CapitalandFunding”forfurtherinformationregardingourtangibleshareholders’equitycalculation.
(4)
Leverageratioequalstotalassetsdividedbyshareholders’equity.
(5)
Adjustedleverageratioequalsadjustedassetsdividedbytangibleequitycapital.Adjustedassetsexcludes(i)low-riskcollateralizedassetsgenerallyassociated
withourmatchedbookandsecuritieslendingbusinesses(whichwecalculatebyaddingoursecuritiespurchasedunderagreementstoresellandsecurities
borrowed,andthensubtractingournonderivativeshortpositions),(ii)cashandsecuritieswesegregateincompliancewithregulationsand(iii)goodwilland
identifiableintangible assets. Tangible equity capital includestangible shareholders’ equityand junior subordinateddebt issued toa trust. Webelieve that
theadjustedleverageratioisamoremeaningfulmeasureofourcapitaladequacybecauseitexcludescertainlow-riskcollateralizedassetsthataregenerally
supportedwithlittleornocapitalandreflectsthetangibleequitycapitaldeployedinourbusinesses.See“FinancialInformation—Management’sDiscussion
andAnalysis—CapitalandFunding”forfurtherinformationregardingouradjustedleverageratiocalculation.
(6)
Debttoequityratioequalslong-termborrowingsdividedbyshareholders’equity.
(7)
Returnonaverageshareholders’equityiscomputedbydividingnetearningsbyaveragemonthlyshareholders’equity.
(8)
Returnonaveragetangibleshareholders’equityiscomputedbydividingnetearningsbyaveragemonthlytangibleshareholders’equity.Webelievethatreturn
onaveragetangibleshareholders’equityisameaningfulmeasureofperformancebecauseitexcludestheportionofourshareholders’equityattributable
togoodwillandidentifiableintangibleassets.Asaresult,thiscalculationmeasurescorporateperformanceinamannerthat treatsunderlyingbusinesses
consistently,whethertheywereacquiredordevelopedinternally.See“FinancialInformation—Management’sDiscussionandAnalysis—ResultsofOperations”
forfurtherinformationregardingourreturnonaveragetangibleshareholders’equitycalculation.