Fujitsu 2009 Annual Report Download - page 9
Download and view the complete annual report
Please find page 9 of the 2009 Fujitsu annual report below. You can navigate through the pages in the report by either clicking on the pages listed below, or by using the keyword search tool below to find specific information within the annual report.-
 1
1 -
 2
2 -
 3
3 -
 4
4 -
 5
5 -
 6
6 -
 7
7 -
 8
8 -
 9
9 -
 10
10 -
 11
11 -
 12
12 -
 13
13 -
 14
14 -
 15
15 -
 16
16 -
 17
17 -
 18
18 -
 19
19 -
 20
20 -
21
-
22
-
23
-
24
-
25
-
26
-
27
-
28
-
29
-
30
-
31
-
32
-
33
-
34
-
35
-
36
-
37
-
38
-
39
-
40
-
41
-
42
-
43
-
44
-
45
-
46
-
47
-
48
-
49
-
50
-
51
-
52
-
53
-
54
-
55
-
56
-
57
-
58
-
59
-
60
-
61
-
62
-
63
-
64
-
65
-
66
-
67
-
68
-
69
-
70
-
71
-
72
-
73
-
74
-
75
-
76
-
77
-
78
-
79
-
80
-
81
-
82
-
83
-
84
-
85
-
86
-
87
-
88
-
89
-
90
-
91
-
92
-
93
-
94
-
95
-
96
-
97
-
98
-
99
-
100
-
101
-
102
-
103
-
104
-
105
-
106
-
107
-
108
-
109
-
110
-
111
-
112
-
113
-
114
-
115
-
116
-
117
-
118
-
119
-
120
-
121
-
122
-
123
-
124
-
125
-
126
-
127
-
128
-
129
-
130
-
131
-
132
-
133
-
134
 |
 |

250.9 249.9
258.7
254.0
241.5
240.2
2004 2005 2006 2007 2008 2009
0
100
200
300
1,277.1
1.54
883.4
0.94
1.18
0.77
1.01
1.26
887.3
745.8
928.6
1,082.7
2004 2005 2006 2007 2008 2009
0
500
1,500
1,000
0
1
3
2
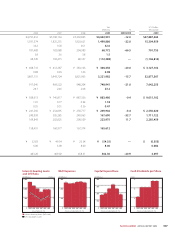
159.7 167.6
249.0
305.2
249.9
181.4
2004 2005 2006 2007 2008 2009
0
200
100
300
400
3.00
8.008.00
6.006.006.00
2004 2005 2006 2007 2008 2009
0
6
3
9
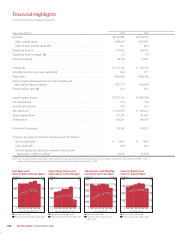
(¥ Billions)(¥ Billions) (Times) (¥ Billions) (Yen)
Interest-bearing loans (left scale)
D/E ratio (right scale)
(Years ended March 31)(As of March 31) (Years ended March 31) (Years ended March 31)
R&D ExpensesInterest-bearing Loans
and D/E Ratio
Capital Expenditure Cash Dividends per Share
Yen
(millions) %
U.S. Dollars
(thousand)
2006 2007 2008 2009 2009/2008 2009
¥4,791,416 ¥5,100,163 ¥5,330,865 ¥4,692,991 –12.0 $47,887,663
1,591,574 1,825,255 1,923,621 1,499,886 –22.0 15,304,959
33.2 35.8 36.1 32.0
181,488 182,088 204,989 68,772 –66.5 701,755
3.8 3.6 3.8 1.5
68,545 102,415 48,107 (112,388) — (1,146,816)
¥ 408,710 ¥ 412,387 ¥ 383,106 ¥ 306,456 –20.0 $ 3,127,102
0.88 0.93 1.03 0.98
3,807,131 3,943,724 3,821,963 3,221,982 –15.7 32,877,367
917,045 969,522 948,204 748,941 –21.0 7,642,255
24.1 24.6 24.8 23.2
¥ 928,613 ¥ 745,817 ¥ 887,336 ¥ 883,480 –0.4 $ 9,015,102
1.01 0.77 0.94 1.18
0.55 0.31 0.36 0.47
¥ 241,566 ¥ 254,095 ¥ 258,717 ¥ 249,902 –3.4 $ 2,550,020
249,999 305,285 249,063 167,690 –32.7 1,711,122
169,843 202,825 200,509 223,975 11.7 2,285,459
158,491 160,977 167,374 165,612
¥ 32.83 ¥ 49.54 ¥ 23.34 ¥ (54.35) — $ (0.555)
6.00 6.00 8.00 8.00 0.082
443.20 469.02 458.31 362.30 –20.9 3.697
007
ANNUAL REPORT 2009
FUJITSU LIMITED