Foot Locker 2012 Annual Report Download - page 92
Download and view the complete annual report
Please find page 92 of the 2012 Foot Locker annual report below. You can navigate through the pages in the report by either clicking on the pages listed below, or by using the keyword search tool below to find specific information within the annual report.
FOOT LOCKER, INC.
NOTES TO CONSOLIDATED FINANCIAL STATEMENTS
23. Commitments − (continued)
The Company does not have any off-balance sheet financing (other than operating leases entered into in
the normal course of business and disclosed above) or unconsolidated special purpose entities. The
Company does not participate in transactions that generate relationships with unconsolidated entities or
financial partnerships, including variable interest entities.
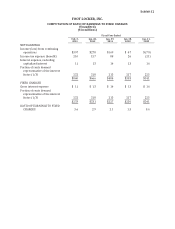
24. Quarterly Results (Unaudited) 1
st
Q2
nd
Q3
rd
Q4
th
Q
(1)
Year
(in millions, except per share amounts)
Sales
2012 1,578 1,367 1,524 1,713 $6,182
2011 1,452 1,275 1,394 1,502 $5,623
Gross margin
(2)
2012 537 428 505 564 $2,034
2011 475 388 453 480 $1,796
Operating profit
(3)
2012 202 93 156 159 $ 610
2011 150 59 106 122 $ 437
Net income
2012 128 59 106 104
(4)(5)
$ 397
2011 94 37 66 81
(4)
$ 278
Basic earnings per share:
2012 0.84 0.39 0.70 0.69 $ 2.62
2011 0.61 0.24 0.43 0.53 $ 1.81
Diluted earnings per share:
2012 0.83 0.39 0.69 0.68 $ 2.58
2011 0.60 0.24 0.43 0.53 $ 1.80
(1) The fourth quarter of 2012 represents the 14 weeks ended February 2, 2013.
(2) Gross margin represents sales less cost of sales.
(3) Operating profit represents income before income taxes, interest expense, net, and non-operating income.
(4) During the fourth quarters of 2012 and 2011, the Company recorded impairment charges of $7 million and $5 million,
respectively, related to its CCS tradename.
(5) During the fourth quarter of 2012, the Company recorded an impairment charge of $5 million related to CCS long-lived assets,
representing a full impairment of the stores net book value as the Company has determined that all the stores will close in the
first quarter of 2013.
72


