Foot Locker 2012 Annual Report Download - page 79
Download and view the complete annual report
Please find page 79 of the 2012 Foot Locker annual report below. You can navigate through the pages in the report by either clicking on the pages listed below, or by using the keyword search tool below to find specific information within the annual report.-
 1
1 -
2
-
3
-
4
-
5
-
6
-
7
-
8
-
9
-
10
-
11
-
12
-
13
-
14
-
15
-
16
-
17
-
18
-
19
-
20
-
21
-
22
-
23
-
24
-
25
-
26
-
27
-
28
-
29
-
30
-
31
-
32
-
33
-
34
-
35
-
36
-
37
-
38
-
39
-
40
-
41
-
42
-
43
-
44
-
45
-
46
-
47
-
48
-
49
-
50
-
51
-
52
-
53
-
54
-
55
-
56
-
57
-
58
-
59
-
60
-
61
-
62
-
63
-
64
-
65
-
66
-
67
-
68
-
 69
69 -
 70
70 -
 71
71 -
 72
72 -
 73
73 -
 74
74 -
 75
75 -
 76
76 -
 77
77 -
 78
78 -
 79
79 -
 80
80 -
 81
81 -
 82
82 -
 83
83 -
 84
84 -
 85
85 -
 86
86 -
 87
87 -
 88
88 -
 89
89 -
90
-
91
-
92
-
93
-
94
-
95
-
96
-
97
-
98
-
99
-
100
-
101
-
102
-
103
-
104
-
105
-
106
-
107
-
108
-
109
-
110
 |
 |

FOOT LOCKER, INC.
NOTES TO CONSOLIDATED FINANCIAL STATEMENTS
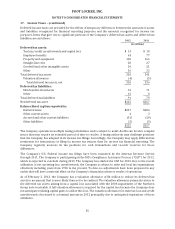
18. Financial Instruments and Risk Management − (continued)
Business Risk
The retailing business is highly competitive. Price, quality, selection of merchandise, reputation, store
location, advertising, and customer service are important competitive factors in the Company’s business.
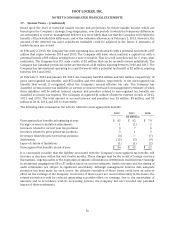
The Company operates in 23 countries and purchased approximately 86 percent of its merchandise in
2012 from its top 5 vendors. In 2012, the Company purchased approximately 65 percent of its athletic
merchandise from one major vendor, Nike, Inc. (‘‘Nike’’), and approximately 17 percent from another
major vendor. Each of our operating divisions is highly dependent on Nike; they individually purchased 48
to 77 percent of their merchandise from Nike. The Company generally considers all vendor relations to be
satisfactory.
Included in the Company’s Consolidated Balance Sheet at February 2, 2013, are the net assets of the
Company’s European operations, which total $909 million and which are located in 19 countries, 11 of
which have adopted the euro as their functional currency.
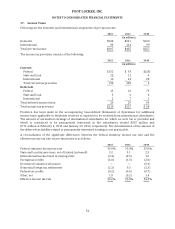
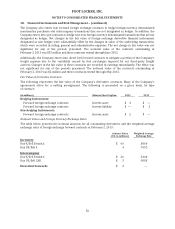
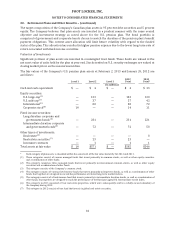
19. Fair Value Measurements
The following table provides a summary of the recognized assets and liabilities that are measured at fair
value on a recurring basis:
As of February 2, 2013 As of January 28, 2012
(in millions)
Level 1 Level 2 Level 3 Level 1 Level 2 Level 3
Assets
Short-term investments $ — $ 48 $ — $ — $ — $ —
Auction rate security — 6 — — 5 —
Forward foreign exchange contracts — 6 — — — —
Total Assets $ — $ 60 $ — $ — $ 5 $ —
Liabilities
Forward foreign exchange contracts — — — — 2 —
Total Liabilities $ — $ — $ — $ — $ 2 $ —
Available-for-sale securities are recorded at fair value with unrealized gains and losses reported, net of tax,
in other comprehensive income, unless unrealized losses are determined to be other than temporary. As of
February 2, 2013, the Company held $54 million of available-for-sale securities, which was comprised of
$48 million in short-term investments and a $6 million auction rate security.
Short-term investments represent corporate bonds with maturity dates within one year from the purchase
date. These securities are valued using quoted prices for similar instruments in active markets and
therefore are classified as Level 2 instruments. Level 2 instrument valuations are obtained from readily
available pricing sources for comparable instruments.
The fair value of the auction rate security is determined by review of the underlying security at each
reporting period.
The Company’s derivative financial instruments are valued using market-based inputs to valuation models.
These valuation models require a variety of inputs, including contractual terms, market prices, yield
curves, and measures of volatility.
Interest income related to the short-term investments included within interest expense was not significant
for 2012.
There were no transfers into or out of Level 1, Level 2, or Level 3 assets and liabilities for any of the
periods presented.
59