Foot Locker 2012 Annual Report Download - page 82
Download and view the complete annual report
Please find page 82 of the 2012 Foot Locker annual report below. You can navigate through the pages in the report by either clicking on the pages listed below, or by using the keyword search tool below to find specific information within the annual report.-
 1
1 -
2
-
3
-
4
-
5
-
6
-
7
-
8
-
9
-
10
-
11
-
12
-
13
-
14
-
15
-
16
-
17
-
18
-
19
-
20
-
21
-
22
-
23
-
24
-
25
-
26
-
27
-
28
-
29
-
30
-
31
-
32
-
33
-
34
-
35
-
36
-
37
-
38
-
39
-
40
-
41
-
42
-
43
-
44
-
45
-
46
-
47
-
48
-
49
-
50
-
51
-
52
-
53
-
54
-
55
-
56
-
57
-
58
-
59
-
60
-
61
-
62
-
63
-
64
-
65
-
66
-
67
-
68
-
69
-
70
-
71
-
 72
72 -
 73
73 -
 74
74 -
 75
75 -
 76
76 -
 77
77 -
 78
78 -
 79
79 -
 80
80 -
 81
81 -
 82
82 -
 83
83 -
 84
84 -
 85
85 -
 86
86 -
 87
87 -
 88
88 -
 89
89 -
 90
90 -
 91
91 -
 92
92 -
93
-
94
-
95
-
96
-
97
-
98
-
99
-
100
-
101
-
102
-
103
-
104
-
105
-
106
-
107
-
108
-
109
-
110
 |
 |

FOOT LOCKER, INC.
NOTES TO CONSOLIDATED FINANCIAL STATEMENTS
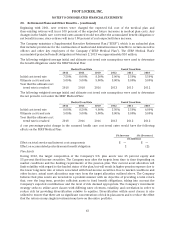
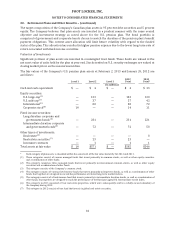
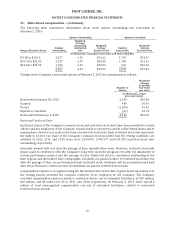
20. Retirement Plans and Other Benefits − (continued)
The following weighted-average assumptions were used to determine the benefit obligations under
the plans:
Pension Benefits Postretirement Benefits
2012 2011 2012 2011
Discount rate 3.79% 4.16% 3.70% 4.00%
Rate of compensation increase 3.68% 3.69%
Pension expense is actuarially calculated annually based on data available at the beginning of each year.
The expected return on plan assets is determined by multiplying the expected long-term rate of return on
assets by the market-related value of plan assets for the U.S. qualified pension plan and market value for
the Canadian qualified pension plan. The market-related value of plan assets is a calculated value that
recognizes investment gains and losses in fair value related to equities over three or five years, depending
on which computation results in a market-related value closer to market value. Market-related value for
the U.S. qualified plan was $550 million and $476 million for 2012 and 2011, respectively. Assumptions
used in the calculation of net benefit cost include the discount rate selected and disclosed at the end of the
previous year as well as other assumptions detailed in the table below:
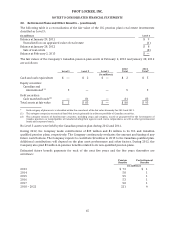
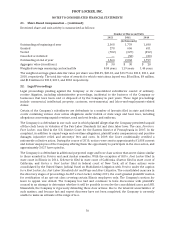
Pension Benefits Postretirement Benefits
2012 2011 2010 2012 2011 2010
Discount rate 4.16% 4.99% 5.25% 4.00% 4.60% 4.90%
Rate of
compensation
increase 3.68% 3.69% 3.68%
Expected long-term
rate of return on
assets 6.63% 6.59% 7.22%
The expected long-term rate of return on invested plan assets is based on the plans’ weighted-average
target asset allocation, as well as historical and future expected performance of those assets. The target
asset allocation is selected to obtain an investment return that is sufficient to cover the expected benefit
payments and to reduce future contributions by the Company.
The components of net benefit expense (income) are:
Pension Benefits Postretirement Benefits
2012 2011 2010 2012 2011 2010
(in millions)
Service cost $ 13 $ 12 $ 13 $ — $ — $ —
Interest cost 28 32 33 — 1 —
Expected return on
plan assets (40) (40) (40) — — —
Amortization of
prior service cost — — — — (1) —
Amortization of net
loss (gain) 17 15 17 (4) (5) (6)
Net benefit expense
(income) $ 18 $ 19 $ 23 $ (4) $ (5) $ (6)
62