Foot Locker 2012 Annual Report Download - page 37
Download and view the complete annual report
Please find page 37 of the 2012 Foot Locker annual report below. You can navigate through the pages in the report by either clicking on the pages listed below, or by using the keyword search tool below to find specific information within the annual report.-
 1
1 -
2
-
3
-
4
-
5
-
6
-
7
-
8
-
9
-
10
-
11
-
12
-
13
-
14
-
15
-
16
-
17
-
18
-
19
-
20
-
21
-
22
-
23
-
24
-
25
-
26
-
 27
27 -
 28
28 -
 29
29 -
 30
30 -
 31
31 -
 32
32 -
 33
33 -
 34
34 -
 35
35 -
 36
36 -
 37
37 -
 38
38 -
 39
39 -
 40
40 -
 41
41 -
 42
42 -
 43
43 -
 44
44 -
 45
45 -
 46
46 -
 47
47 -
48
-
49
-
50
-
51
-
52
-
53
-
54
-
55
-
56
-
57
-
58
-
59
-
60
-
61
-
62
-
63
-
64
-
65
-
66
-
67
-
68
-
69
-
70
-
71
-
72
-
73
-
74
-
75
-
76
-
77
-
78
-
79
-
80
-
81
-
82
-
83
-
84
-
85
-
86
-
87
-
88
-
89
-
90
-
91
-
92
-
93
-
94
-
95
-
96
-
97
-
98
-
99
-
100
-
101
-
102
-
103
-
104
-
105
-
106
-
107
-
108
-
109
-
110
 |
 |

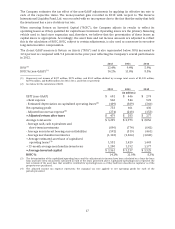
The Company estimates the tax effect of the non-GAAP adjustments by applying its effective tax rate to
each of the respective items. The money-market gain recorded in 2010 with respect to The Reserve
International Liquidity Fund, Ltd. was recorded with no tax expense due to the fact that the entity that held
the investment has a zero statutory tax rate.
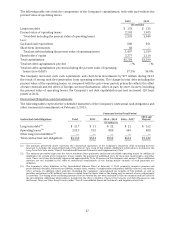
When assessing Return on Invested Capital (‘‘ROIC’’), the Company adjusts its results to reflect its
operating leases as if they qualified for capital lease treatment. Operating leases are the primary financing
vehicle used to fund store expansion and, therefore, we believe that the presentation of these leases as
capital leases is appropriate. Accordingly, the asset base and net income amounts are adjusted to reflect
this in the calculation of ROIC. ROIC, subject to certain adjustments, is also used as a measure in executive
long-term incentive compensation.
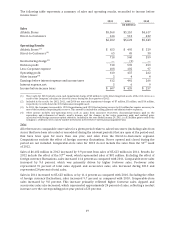
The closest GAAP measure is Return on Assets (‘‘ROA’’) and is also represented below. ROA increased to
12.4 percent as compared with 9.4 percent in the prior year reflecting the Company’s overall performance
in 2012.
2012 2011 2010
ROA
(1)
12.4% 9.4% 5.9%
ROIC % (non-GAAP)
(2)
14.2% 11.8% 8.3%
(1) Represents net income of $397 million, $278 million, and $169 million divided by average total assets of $3,209 million,
$2,973 million, and $2,856 million for 2012, 2011, and 2010, respectively.
(2) See below for the calculation of ROIC.
2012 2011 2010
(in millions)
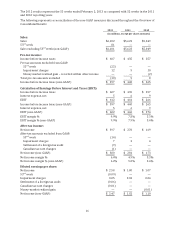
EBIT (non-GAAP) $ 602 $ 446 $ 274
+ Rent expense 560 544 522
- Estimated depreciation on capitalized operating leases
(3)
(409) (389) (366)
Net operating profit 753 601 430
- Adjusted income tax expense
(4)
(274) (218) (153)
= Adjusted return after taxes $ 479 $ 383 $ 277
Average total assets $ 3,209 $ 2,973 $ 2,856
- Average cash, cash equivalents and
short-term investments (890) (774) (642)
- Average non-interest bearing current liabilities (592) (519) (461)
- Average merchandise inventories (1,118) (1,064) (1,048)
+ Average estimated asset base of capitalized
operating leases
(3)
1,552 1,429 1,443
+ 13-month average merchandise inventories 1,200 1,192 1,177
= Average invested capital $ 3,361 $ 3,237 $ 3,325
ROIC % 14.2% 11.8% 8.3%
(3) The determination of the capitalized operating leases and the adjustments to income have been calculated on a lease-by-lease
basis and have been consistently calculated in each of the years presented above. Capitalized operating leases represent the
best estimate of the asset base that would be recorded for operating leases as if they had been classified as capital or as if the
property were purchased.
(4) The adjusted income tax expense represents the marginal tax rate applied to net operating profit for each of the
periods presented.
17