Foot Locker 2012 Annual Report Download - page 45
Download and view the complete annual report
Please find page 45 of the 2012 Foot Locker annual report below. You can navigate through the pages in the report by either clicking on the pages listed below, or by using the keyword search tool below to find specific information within the annual report.-
 1
1 -
2
-
3
-
4
-
5
-
6
-
7
-
8
-
9
-
10
-
11
-
12
-
13
-
14
-
15
-
16
-
17
-
18
-
19
-
20
-
21
-
22
-
23
-
24
-
25
-
26
-
27
-
28
-
29
-
30
-
31
-
32
-
33
-
34
-
 35
35 -
 36
36 -
 37
37 -
 38
38 -
 39
39 -
 40
40 -
 41
41 -
 42
42 -
 43
43 -
 44
44 -
 45
45 -
 46
46 -
 47
47 -
 48
48 -
 49
49 -
 50
50 -
 51
51 -
 52
52 -
 53
53 -
 54
54 -
 55
55 -
56
-
57
-
58
-
59
-
60
-
61
-
62
-
63
-
64
-
65
-
66
-
67
-
68
-
69
-
70
-
71
-
72
-
73
-
74
-
75
-
76
-
77
-
78
-
79
-
80
-
81
-
82
-
83
-
84
-
85
-
86
-
87
-
88
-
89
-
90
-
91
-
92
-
93
-
94
-
95
-
96
-
97
-
98
-
99
-
100
-
101
-
102
-
103
-
104
-
105
-
106
-
107
-
108
-
109
-
110
 |
 |

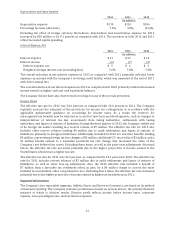
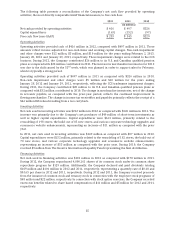
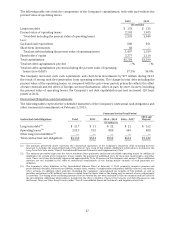
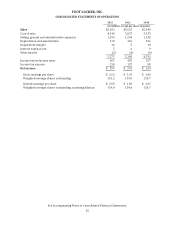
The following table presents a reconciliation of the Company’s net cash flow provided by operating
activities, the most directly comparable GAAP financial measure, to free cash flow.
2012 2011 2010
(in millions)
Net cash provided by operating activities $ 416 $ 497 $326
Capital expenditures (163) (152) (97)
Free cash flow (non-GAAP) $ 253 $ 345 $229
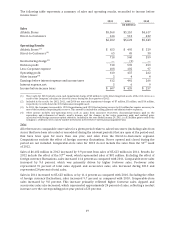
Operating Activities
Operating activities provided cash of $416 million in 2012, compared with $497 million in 2011. These
amounts reflect income adjusted for non-cash items and working capital changes. Non-cash impairment
and other charges were $12 million, $5 million, and $10 million for the years ending February 2, 2013,
January 28, 2012 and January 29, 2011, respectively. These impairment charges were related to the CCS
business. During 2012, the Company contributed $26 million to its U.S. and Canadian qualified pension
plans as compared with $28 million contributed in 2011. The increase in merchandise inventories for 2012
was due to the shift caused by the 53
rd
week, which was planned in order to support sales for February,
which is typically a strong period.
Operating activities provided cash of $497 million in 2011 as compared with $326 million in 2010.
Non-cash impairment and other charges were $5 million and $10 million for the years ending
January 28, 2012 and January 29, 2011, respectively, reflecting the CCS tradename impairment charges.
During 2011, the Company contributed $28 million to its U.S. and Canadian qualified pension plans as
compared with $32 million contributed in 2010. The change in merchandise inventories, net of the change
in accounts payable, as compared with the prior-year period, reflects the continued improvement in
flowing merchandise. The change in income tax receivables and payables primarily reflects the receipt of a
$46 million IRS refund resulting from a loss carryback.
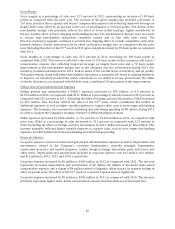
Investing Activities
Net cash used in investing activities was $212 million in 2012 as compared with $149 million in 2011. The
increase was primarily due to the Company’s net purchases of $49 million of short-term investments as
well as higher capital expenditures. Capital expenditures were $163 million, primarily related to the
remodeling of 198 stores, the build-out of 85 new stores, and various corporate technology upgrades and
ecommerce website enhancements, representing an increase of $11 million as compared with the prior
year.
In 2011, net cash used in investing activities was $149 million as compared with $87 million in 2010.
Capital expenditures were $152 million, primarily related to the remodeling of 182 stores, the build-out of
70 new stores, and various corporate technology upgrades and ecommerce website enhancements,
representing an increase of $55 million as compared with the prior year. During 2010, the Company
received $9 million from The Reserve International Liquidity Fund representing the final distribution.
Financing Activities
Net cash used in financing activities was $181 million in 2012 as compared with $178 million in 2011.
During 2012, the Company repurchased 4,000,161 shares of its common stock under its common share
repurchase program for $129 million. Additionally, the Company declared and paid dividends totaling
$109 million and $101 million in 2012 and 2011, respectively, representing a quarterly rate of $0.18 and
$0.165 per share in 2012 and 2011, respectively. During 2012 and 2011, the Company received proceeds
from the issuance of common stock and treasury stock in connection with the employee stock programs of
$48 million and $22 million, respectively. In connection with stock option exercises, the Company recorded
excess tax benefits related to share-based compensation of $11 million and $5 million for 2012 and 2011,
respectively.
25