Foot Locker 2012 Annual Report Download - page 4
Download and view the complete annual report
Please find page 4 of the 2012 Foot Locker annual report below. You can navigate through the pages in the report by either clicking on the pages listed below, or by using the keyword search tool below to find specific information within the annual report.-
 1
1 -
 2
2 -
 3
3 -
 4
4 -
 5
5 -
 6
6 -
 7
7 -
 8
8 -
 9
9 -
 10
10 -
 11
11 -
 12
12 -
 13
13 -
 14
14 -
 15
15 -
16
-
17
-
18
-
19
-
20
-
21
-
22
-
23
-
24
-
25
-
26
-
27
-
28
-
29
-
30
-
31
-
32
-
33
-
34
-
35
-
36
-
37
-
38
-
39
-
40
-
41
-
42
-
43
-
44
-
45
-
46
-
47
-
48
-
49
-
50
-
51
-
52
-
53
-
54
-
55
-
56
-
57
-
58
-
59
-
60
-
61
-
62
-
63
-
64
-
65
-
66
-
67
-
68
-
69
-
70
-
71
-
72
-
73
-
74
-
75
-
76
-
77
-
78
-
79
-
80
-
81
-
82
-
83
-
84
-
85
-
86
-
87
-
88
-
89
-
90
-
91
-
92
-
93
-
94
-
95
-
96
-
97
-
98
-
99
-
100
-
101
-
102
-
103
-
104
-
105
-
106
-
107
-
108
-
109
-
110
 |
 |

3
BUILDING MOMENTUM
In my leer to you in last year’s annual report, I high-
lighted six updated strategies that we believed would enable
Foot Locker, Inc. to connue to build momentum in our
operaonal and nancial performance. One year later, I
am pleased to be able to report to you that, by steadfastly
execung the iniaves underlying those strategies, we did
build our momentum in 2012. From 2011, which was the
most protable year in our history as an athlec footwear
and apparel company, we produced an EPS increase of over
35 percent in 2012. In fact, as shown in the table below, we
connue to produce signicant gains towards all of the key
nancial objecves we established last year to help measure
our progress. Our progress and results have been consis-
tently strong and, while we are excited about our momen-
tum, more importantly, we remain energized by the many
opportunies ahead of us to elevate our performance even
further towards achieving our vision
Original Current
5-Year Plan Long-Term
2009 Objecve* 2012 Objecve
Sales (billions) $4.9 $6.0 $6.1 $7.5
Sales per Gross Square Foot $333 $400 $443 $500
Adjusted EBIT Margin 2.8% 8.0% 9.9% 11.0%
Adjusted Net Income Margin 1.8% 5.0% 6.2% 7.0%
Return on Invested Capital 5.3% 10.0% 14.2% 14.0%
*Our original objecves were established in early 2010 and replaced by the
current long-term objecves in early 2012.
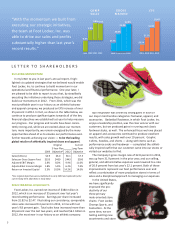
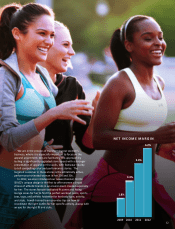
2012 FINANCIAL HIGHLIGHTS
Foot Locker, Inc. earned net income of $380 million in
2012, which is an increase of 35 percent over last year’s
record-seng performance. Earnings per share increased
from $1.82 to $2.47. Illustrang our consistency, comparable
store sales increased 9.4 percent in 2012, in line with last
year’s 9.8 percent gain. Total sales have increased more than
20 percent over the last two years, and reached $6.1 billion in
2012, the most ever in our history as an athlec company.
Top line growth was driven by strong gains in each of
our major merchandise categories: footwear, apparel, and
accessories. Basketball footwear, in which Foot Locker, Inc.
enjoys a leadership posion, was the clear winner with our
customers, but we produced gains in running and classic
footwear styles, as well. The enhanced focus we have placed
on apparel and accessories connued to produce excellent
results, with sales growth well over 10 percent. Graphic
t-shirts, hoodies, and shorts --- along with items such as
performance socks and headwear --- completed the athle-
cally inspired ouit that our customer came into our stores or
visited our websites to nd.
The Company’s gross margin rate of 32.8 percent in 2012,
was up from 31.9 percent in the prior year, and our selling,
general, and administrave expenses were lowered to a rate
of 20.9 percent from last year’s 22.1 percent. Both of these
improvements represent our best performance ever and
reect a combinaon of more producve stores in terms of
sales and a disciplined approach to managing our expenses.
In the United States,
we have signicantly
improved the pro-
ducvity of our
three primary
male-oriented store
chains: Foot Locker,
Champs Sports, and
Footacon. At the
same me, we are
tesng excing new
assortments and store
LETTER TO SHAREHOLDERS
“With the momentum we built from
executing our strategic initiatives,
the team at Foot Locker, Inc. was
able to drive our sales and profits
substantially higher than last year’s
record results.”
COMP
SALES
2009 2010 2011 2012
GROSS
MARGIN
2009 2010 2011 2012
EPS
$0.54
$1.10
$1.82
$2.47
2009 2010 2011 2012