Foot Locker 2002 Annual Report Download - page 51
Download and view the complete annual report
Please find page 51 of the 2002 Foot Locker annual report below. You can navigate through the pages in the report by either clicking on the pages listed below, or by using the keyword search tool below to find specific information within the annual report.-
 1
1 -
2
-
3
-
4
-
5
-
6
-
7
-
8
-
9
-
10
-
11
-
12
-
13
-
14
-
15
-
16
-
17
-
18
-
19
-
20
-
21
-
22
-
23
-
24
-
25
-
26
-
27
-
28
-
29
-
30
-
31
-
32
-
33
-
34
-
35
-
36
-
37
-
38
-
39
-
40
-
 41
41 -
 42
42 -
 43
43 -
 44
44 -
 45
45 -
 46
46 -
 47
47 -
 48
48 -
 49
49 -
 50
50 -
 51
51 -
 52
52 -
 53
53 -
 54
54 -
 55
55 -
 56
56
 |
 |

49
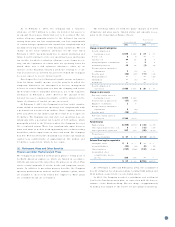
Under the Co mpany’s 1994 Emplo yees Sto ck Purchase Plan,
participating emplo yees may co ntribute up to 10 percent of their
annual compensatio n to ac quire shares of commo n sto ck at 85
percent of the lo wer market price o n o ne o f two specified dates
in each plan year. Of the 8,000,000 shares o f co mmo n sto ck
authorized fo r purchase under this plan, 745 partic ipating
employees purchased 254,115 shares in 2002. To date, a to tal of
1,507,968 shares have been purchased under this plan.
When co mmo n sto ck is issued under these plans, the proceeds
fro m o ptio ns exercised o r shares purchased are credited to co m-
mo n sto ck to the extent o f the par value o f the shares issued and
the excess is credited to additio nal paid-in capital. When treasury
co mmo n sto ck is issued, the difference between the average c o st
of treasury sto ck used and the proceeds from o ptio ns exercised o r
shares awarded o r purchased is charged o r c redited, as appro pri-
ate, to either additional paid-in capital o r retained earnings. The
tax benefits relating to amo unts deductible fo r federal inco me tax
purposes, which are no t included in inco me fo r financial repo rting
purposes, have been credited to additio nal paid-in capital.
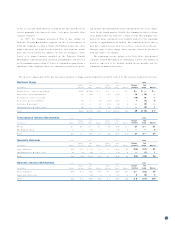
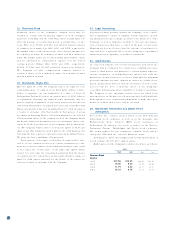
The fair values of the issuance o f the sto ck-based co mpensatio n pursuant to the Co mpany’s vario us sto ck o ption and purchase plans
were estimated at the grant date using a Black- Scho les o ptio n pricing mo del.
Sto c k Optio n Plans Sto ck Purchase Plan
2002 2001 2000 2002 2001 2000
Weighted- average risk free rate o f interest 4.1 7% 4.17% 6.43% 2.59% 3.73% 5.36%
Expected vo latility 42% 48% 55% 35 % 40% 46%
Weighted- average expected award life 3.5 years 4.0 years 3.9 ye ars .7 years .7 years .7 years
Dividend yield 1.2 % — — —— —
Weighted- average fair value $5.11 $5.31 $4.99 $4 .23 $4.42 $2.86
The Black-Scho les o ptio n valuatio n model was develo ped fo r
estimating the fair value o f traded o ptions that have no vesting
restrictions and are fully transferable. Because o ptio n valuatio n
mo dels require the use of subjective assumptio ns, changes in
these assumptio ns can materially affect the fair value of the
o ptio ns, and bec ause the Co mpany’s o ptio ns do no t have the char-
acteristics of traded o ptio ns, the o ptio n valuatio n models do no t
nec essarily pro vide a reliable measure of the fair value o f its
o ptio ns.
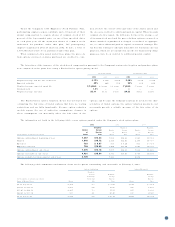
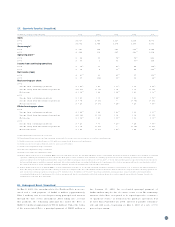
The info rmatio n set fo rth in the fo llo wing table co vers o ptio ns g ranted under the Co mpany’s sto ck o ption plans:
2002 2001 2000
Wei ght ed- Weig hted- Weig hted-
Number Average Number Ave rage Numb er Average
of Exercise o f Exe rcise of Exe rcise
( in tho usands, exc ept prices per share) Shares Price Shares Price Shares Price
Optio ns o utstanding at beg inning of year 7,5 57 $ 14.6 3 7,696 $14.49 9,923 $15.12
Granted 1 ,640 $ 1 5.7 2 2,324 $12.81 2,167 $10.50
Exe rcised 7 83 $ 6.67 995 $ 7.28 811 $ 5.17
Expired o r c anceled 73 8 $ 19.8 0 1,468 $15.98 3,583 $15.93
Optio ns o utstanding at end of year 7,6 7 6 $1 5.1 8 7,557 $14.63 7,696 $14.49
Optio ns exercisable at end of ye ar 4,4 81 $ 15.9 4 4,371 $16.83 4,047 $18.78
Optio ns available fo r future g rant at end o f year 6,739 7,389 8,652
The follo wing table summarizes info rmatio n abo ut sto ck o ptio ns o utstanding and exercisable at February 1, 2003:
Optio ns Outstanding Optio ns Exercisable
Weighte d-
Average We ig hted- We ig hted-
Remaining Average Average
( in tho usands, except prices per share) Co ntrac tual Exercise Exercise
Range o f Exercise Prices Shares Life Price Shares Price
$4.53 to $11.91 2, 354 7.0 $ 9.83 1,616 $ 9.14
$12.31 to $15.75 1,955 6.8 13.80 980 14.39
$15.85 to $22.19 2,437 7.0 17.56 955 19.93
$22.41 to $30.38 930 4.1 25.45 930 25.45
$4.53 to $30.38 7,676 6.6 $15.18 4,481 $15.94