Foot Locker 2002 Annual Report Download - page 20
Download and view the complete annual report
Please find page 20 of the 2002 Foot Locker annual report below. You can navigate through the pages in the report by either clicking on the pages listed below, or by using the keyword search tool below to find specific information within the annual report.-
 1
1 -
2
-
3
-
4
-
5
-
6
-
7
-
8
-
9
-
 10
10 -
 11
11 -
 12
12 -
 13
13 -
 14
14 -
 15
15 -
 16
16 -
 17
17 -
 18
18 -
 19
19 -
 20
20 -
 21
21 -
 22
22 -
 23
23 -
 24
24 -
 25
25 -
 26
26 -
 27
27 -
 28
28 -
 29
29 -
 30
30 -
31
-
32
-
33
-
34
-
35
-
36
-
37
-
38
-
39
-
40
-
41
-
42
-
43
-
44
-
45
-
46
-
47
-
48
-
49
-
50
-
51
-
52
-
53
-
54
-
55
-
56
 |
 |

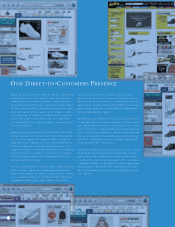
Fo o t Lo cker, Inc., thro ug h its subsidiaries ( Fo o t Lo cker, Inc. and
its subsidiaries being hereafter referred to as the “ Co mpany”)
o perates in two repo rtable segments – Athletic Stores and
Direct-to -Custo mers. The Athletic Stores segment is o ne o f the
largest athletic fo o twear and apparel retailers in the wo rld,
who se fo rmats include Fo o t Lo cker, Lady Fo o t Lo cker, Kids Fo o t
Lo cker and Champs Spo rts. The Direct- to - Custo mers segment
reflec ts Fo o tlo c ker. co m, Inc., which sells, thro ug h its affiliates,
inc luding Eastbay, Inc., to custo mers thro ugh catalo gs and
Internet websites.
All references to co mparable-sto re sales fo r a given perio d
relate to sales o f sto res that are o pen at the perio d- end and that
have been o pen fo r mo re than o ne year. Accordingly, sto res
o pened and clo sed during the perio d are no t included. All co m-
parable-sto re sales increases and decreases exclude the impact of
fo reign currency fluctuatio ns.
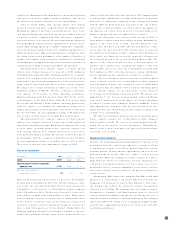
The follo wing table summarizes sales by segment, after reclassi-
ficatio n fo r businesses dispo sed. The dispo sed c atego ry is included
in co ntinuing o peratio ns and represents all business fo rmats so ld o r
closed o ther than disco ntinued business segments. The dispo sitio n
of all businesses previo usly held fo r dispo sal was co mpleted in 2001.
The 2002 and 2001 repo rting years included 52 weeks compared
with the 2000 repo rting year, which included 53 weeks.
( in millio ns) 2002 2001 2000
Athletic Sto re s $4,160 $3,999 $3,953
Direc t- to - Custo me rs 349 326 279
4,509 4,325 4,232
Dispo sed( 1 ) —54 124
$4,509 $4,379 $4,356
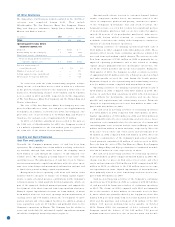
Operating profit befo re c o rpo rate expense, net reflects inco me
fro m co ntinuing o peratio ns befo re inco me taxes, corpo rate expense,
non-o perating inc o me and net interest expense. The fo llo wing table
reco nciles o perating profit befo re corpo rate expense, net by seg-
ment to inco me fro m co ntinuing operatio ns befo re inco me taxes.
( in millio ns) 2002 2001 2000
Athletic Sto re s $279 $283 $269
Direc t- to - Custo me rs 40 24 1
Operating profit befo re c o rpo rate
expense, net from o ngo ing o peratio ns 319 307 270
Dispo sed( 1 ) —( 12 ) ( 2)
Restructuring inco me ( charges) ( 2) 2( 33 ) ( 7)
Gain ( lo ss) o n sale o f businesse s( 3 ) —1 ( 1)
To tal o perating profit befo re
co rpo rate expense, net 321 263 260
Co rporate expense ( 4 ) 52 65 79
To tal o perating profit 269 198 181
No n-o perating inc o me 3117
Interest expense, net 26 24 22
Inco me from co ntinuing o perations
befo re inco me taxes( 5 ) $246 $175 $176
( 1) Inc ludes The San Francisco Music Bo x Co mpany, Foo t Lo cker Outlets, Go ing to the Game! ,
Randy Rive r Canada, Burger King and Po peye’s franc hises and Fo ot Lo cker Asia.
( 2) Restructuring inco me o f $2 millio n in 2002 and restructuring charges of $33 millio n and $7
millio n in 2001 and 20 00, respec tively, reflect the dispo sitio n o f no n-c o re businesses and an
ac ce lerated sto re closing prog ram.
( 3) 2001 reflects a $1 millio n adjustme nt to the $1 64 millio n g ain o n sale o f Aftertho ughts in
1999. 20 00 reflec ts a $1 millio n adjustment to the g ain o f $19 millio n reco g nized o n the sale
of Garden Centers in 1998 .
( 4) 2001 include s a $1 millio n restructuring c harge relate d to the 1999 clo sure o f a distributio n
center. 2000 includes a $6 millio n reduc tio n in previo us restructuring c harges.
( 5) 2 000 include s $16 millio n from the 53 rd week.
Co rpo rate expense included deprec iation and amo rtizatio n of
$26 millio n in 2002, $28 million in 2001 and $29 millio n in 2000.
Co rpo rate expense in 2002 declined co mpared with 2001 primarily
reflec ting decreased payro ll expenses related to reduc tio ns in
headco unt. Co rpo rate expense in 2002 was also reduced by a net
fo reign exchange gain of $4 millio n related to interco mpany fo r-
eig n currency deno minated firm co mmitments. Co rpo rate expense
decreased in 2001 co mpared with 2000 primarily as a result o f
decreased c o mpensatio n co sts fo r incentive bo nuses.
Sales
Sales of $4,509 millio n in 2002 increased 3.0 percent from sales
of $4,379 millio n in 2001. Excluding sales fro m businesses dis-
po sed and the effect o f foreign c urrency fluctuatio ns, 2002 sales
inc reased by 3.1 percent as co mpared with 2001 primarily as a
result o f the new sto re opening pro gram. Co mparable-sto re sales
inc reased by 0.1 percent.
Sales of $4,379 millio n in 2001 increased 0.5 percent from
sales of $4,356 million in 2000. Excluding sales from businesses
dispo sed, the 53rd week in 2000, and the effect o f fo reign c urrency
fluctuatio ns, 2001 sales increased by 4. 4 percent as compared with
2000, reflecting an increase o f 4.9 percent in co mparable-sto re
sales fo r o ngo ing fo rmats.
Result s of Operations
Gross Margin
Gross margin, as a percentage o f sales, o f 29.8 percent declined
by 10 basis po ints in 2002 as compared with 29.9 percent in
2001, primarily resulting from the increase in the co st o f mer-
chandise, as a percentage o f sales, due to increased markdo wn
activity. Vendo r allowances increased by $13 millio n as co mpared
with the prio r year perio d. The impact of these vendo r allo wances
was an improvement in g ro ss margin in 2002, as a percentage o f
sales, o f 30 basis po ints as co mpared with 2001.
Gross margin, as a percentage o f sales, o f 29.9 percent
declined by 20 basis po ints in 2001 from 30.1 percent in 2000,
reflec ting increased o cc upancy and buying co sts. Excluding the
impact of the 53rd week in 2000, gross margin, as a percentage
of sales, was unchanged in 2001.
Selli ng, General and Administrat ive Expenses
Selling , general and administrative expenses ( “ SG&A” ) increased
by $5 millio n in 2002 to $928 millio n. The increase included
$13 millio n related to new sto re o penings, $11 millio n related to
the impact o f fo reign currency fluctuatio ns primarily related to the
euro and $10 millio n related to increased pensio n costs. The
inc rease in pensio n c o sts resulted fro m the decline in plan asset
values and the expec ted lo ng-term rate of return used to deter-
mine the expense. These increases were partially o ffset by
$29 millio n in the reduction in SG&A expenses related to the dis-
po sitio ns o f The San Francisco Music Box Co mpany and the Burger
King and Po peye’s franchises during the third quarter of 2001 and
a $3 millio n increase in inco me related to the po stretirement plan.
The increase in po stretirement inco me o f $3 millio n resulted from
the amo rtizatio n of the asso ciated gains. SG&A, as a percentage
of sales, dec reased to 20.6 percent in 2002 fro m 21. 1 percent in
2001. During 2002, the Co mpany recorded asset impairment
charges o f $6 millio n and $1 millio n related to the Kids Fo o t
Lo cker and Lady Fo o t Lo c ker fo rmats, respectively, co mpared with
MANAGEMENT ’SDISCUSSION AND ANALYSIS OF
FINANCIAL CONDITION AND RESULTS OF OPERATIONS
18